Translate

Thursday, December 23, 2021

What3Words - Expressing Your Location in Three Words

How many times that you had to wait so long for your taxi due to the wrong location? In these pandemic days, how many times has your order is not delivered to your location again due to an invalid location. What3Words is a simple way of expressing your location.


What3words has divided the world into three-meter squares, each with a unique three-word address made from three random words. Now people can refer to any precise location. for example, my location is ///quack.competent.workflow.


You can share the location and another 3-word location for navigating. 3-word addresses are appearing on contact pages, business cards, travel guides and physical signs all around the world. People are using the free what3words app to find friends faster, get accurate directions to that tucked away Airbnb and to drive, or ride, exactly where they want to go.

what3words is available in 40 languages, enabling over 4 billion people to use the system in their native tongue. It can be used via the free mobile app or online map. 

Monday, November 22, 2021

Most Popular Software Programming Languages In Pictures

If you are a developer you might be wondering what is the best language for application development. Let us look at it from some pictures. 


Obviously, JAVA is the winner and you can see C, C++ is also in the higher ranking. However, not sure the reason for the higher ranking on Visual Basic .NET over C#.
Following is the ranking from IEEE. 


JAVA is the non-dispute leader in this ranking as well and it too has the same ranking as previous. The notable observation is the growth of R language over the years. It has jumped to rank 6 from 9. 

Another important parameter is the Salary and Job opening.


Though JAVA has a lot of openings than other programming languages, the average salary is higher in other languages such as Python, C++, Ruby etc.

Finally, let us compare the different aspects of programming languages. 

Thursday, November 18, 2021

Cluster Validation - Purity Calculation

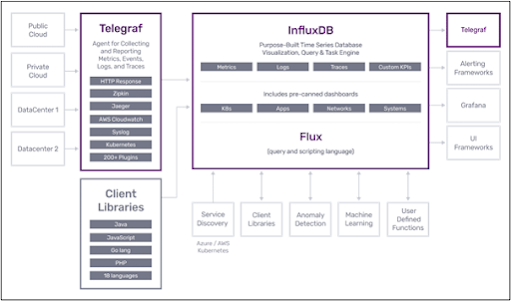
As we know, clustering is an unsupervised technique. When it comes to classification, there are a lot of evaluation techniques such as Precision, Recall, F1, MCC etc. However, what are the techniques that can be used to evaluate clustering techniques. Purity calculation is one of the simplest calculations to evaluate your clusters.

In the Purity cluster quality measure, we will analyse the cluster distribution with respect to a selected variable. Let us look at how to calculate Purity in a Text Clustering using Orange and the following is the Orage flow. 


Further, you can get the Orange flow from Github
First, let us look at how the Purity is calculated. 
Let us assume that following are the clusters and data distribution.


In each cluster, the maximum number of objects that are falling to each cluster is calculated. For example, in Cluster 1, X has three instances while Cluster 2 has three instances of O and Cluster 3 has four L instances. Those numbers are added up and divided by the total number of instances which is 16. 

Let us look at this example with our popular film review dataset.

After the text Preprocessing, the Loving Clustering technique is used. Following is the cluster distribution with respect to the review classification.

So the Purity is (190 + 193 + 158 + 123+ 136 + 112+124+102 +11) / 2000. Ideally, this should be close to 1 meanwhile in the case of multi-class we can calculate the Purity with a Minimum value which should be close to 0. 
Entropy is another calculation that is performed to measure the Cluster Quality which we will leave for another day.

Saturday, November 13, 2021

Hasan Ali & Tweets


As they say in Cricket, "Catches win matches". It will be more relevant when you missed a catch in the WorldCup semi-final.  During the T20I world cup when Hasan Ali dropped the catch, the match turned to head to tail. As cricket is a great game of uncertainty, the crowd don't believe in that. After the dropped catch, there were a lot of allegations against Hasan Ali. It went to an extent that his wife and his religion also are part of these allegations. 
Let us analyse tweets against Hasan Ali using Tweet Sentiment Visualization App

Though there were a lot of hate comments against Hasan Ali on Facebook, Instagram etc, Twitter users are seems to be more professional as we see a lot of positive tweets against him. Some tweets wishing him success as well. 

When you look at the topics, catch, stay strong are the common topics. 
Then let us look at the Tag Cloud in different quadrants. 


Friday, November 5, 2021

Microsoft SQL Server 2022

After three years, Microsoft is gearing up to release its next version of its flagship database product Microsoft SQL Server which is 2022. As for every new release, obvious question us what are the new features.


You can get more details from the following references.

Announcing SQL Server 2022 preview: Azure-enabled with continued performance and security innovation - Microsoft SQL Server Blog

SQL Server 2022 | Microsoft

What's new in SQL Server 2022 - YouTube

PASS Data Community Summit November 8-12 2021 

SQL Server 2022 integrates with Azure Synapse Link and Azure Purview which will enable its users to drive more insights, predictions, and governance from their data at a higher scale. Cloud integration is enhanced with disaster recovery (DR) to Azure SQL Managed Instance, along with no-ETL (extract, transform, and load) connections to cloud analytics, which allow database administrators to manage their data estates with greater flexibility and minimal impact to the end-user. Performance and scalability are automatically enhanced via built-in query intelligence. There is choice and flexibility across languages and platforms, including Linux, Windows, and Kubernetes.

Thursday, November 4, 2021

Article: Use Replication to improve the ETL process in SQL Server


As we have discussed in many articles, ETL is one of the challenging tasks in a Data Warehouse. It is important to extract data from data sources without impacting the performance of the data sources. in SQL Server, replication can be used to safeguard the performance of data sources during the ETL. Read this article Use Replication to improve the ETL process in SQL Server.

Sunday, October 24, 2021

Federalist Papers : Case for Naïve Bayes Text Classification

Alexander Hamilton, James Madison, and John Jay

The Federalist Papers is a collection of 85 articles and essays written by Alexander Hamilton, James Madison, and John Jay. 1787 after the UK was thrown out from US, many were in the view that 13 counties should rule independently. 

John Jay, James Madison, Alexander Hamilton wrote letters independently to pursue that the US should have a strong central government with the individual state government. Between 1787 - 1788 these papers were published under the pseudonym PUBLIS. While the authorship of 73 of The Federalist essays is fairly certain, the identities of those who wrote the twelve remaining essays are disputed by some scholars. In 1963 this dispute was fixed by Mosteller and Wallace using Bayesian Methods.

Let us see do a simple analysis of these papers by performing a analyse of the titles of these papers using the Orange Data Mining Tool. You can retrieve the sample files and the Orange workflow from dineshasanka/FederalistPapersOrangeDataMining (github.com)

Following is the Orange Data Mining workflow and let us go through important controls. 

After importing the CSV, text was preprocessed and word cloud was generated to identify the word distribution. 


Bags of Words are used to identify the keywords. Then six classifiers are used which are Neural Network, Naive Bayes, Decision Trees, Random Forest, SVM and AdaBoost. Following is the evaluation results and it shows that the Random Forest technique has the edge over the other techniques 

We can build the decision tree as shown below. 

Saturday, October 23, 2021

Monitor Your System Metrics With InfluxDB Cloud in Under One Minute

InfluxDB is a Time Series stack that will provide end-to-end features to capture, store and present time series data. 

Following is the InfluxDB 2.0 stack that covers all aspects of time series data.

Influx DB 2.0 stack

Let us see how we can use InfluxDB 2.0 to monitor the operating system. 

First, you need to create a account to FluxDB Could. 

Next is to create a bucket to store the data. 


Creating a Bucket in InfluxDB

After the bucket is created, you need to configure the plugin from Telegraf. 

Configuring the Plugin

Now you need to set the environment variable and need to execute Telegraf by using the following commands. 


Then you can create a query from the following. 


You can create the graph as below. 
 

Thursday, October 21, 2021

Resumable Index Rebuilding in SQL Server 2017

Index rebuild is one of the important tasks in Index Maintenance. As you know Index Rebuild run in a Transaction which means if you abort the Index Rebuild, you have to start all over again. Index Reorganizing is not under Transaction which means you can start from where you left. However, Index Rebuild will solve both Internal and External Index Fragmentation, Index Rebuild is the better option that you would like to go. 

As Index Rebuild will consume a lot of resources from the system, many users would like to perform Index Rebuild in a scheduled manner. This is now possible with SQL Server 2017 and SQL Server 2019. This feature is called the Resumable index. 

Let us see how we can demonstrate this feature. Let us create a table and populate it with the following code.

CREATE TABLE SampleData (ID INT IDENTITY(1,1) PRIMARY KEY CLUSTERED,
Name CHAR(1000),
AddressI CHAR(100)
)


INSERT INTO SampleData
(Name, AddressI)
VALUES
('DINESH','AddressI')
GO 2000000
Now we can rebuild the index with the RESUMABLE option is set to ON.

ALTER INDEX [PK__SampleD] ON [dbo].[SampleData]
REBUILD WITH (ONLINE = ON, RESUMABLE = ON);

Now you can PAUSE and RESUME the index. 

ALTER INDEX [PK__SampleD] ON [SampleData]  PAUSE


ALTER INDEX [PK__SampleD] ON [SampleData]  RESUME

After pausing the index, you can see what percentage of index rebuilding is done with a few other details.

SELECT total_execution_time, percent_complete, 
   name,
   state_desc,last_pause_time,
   page_count
FROM sys.index_resumable_operations;


However, until you complete the index rebuild, the transaction log is utilised which is an important fact to remember. 


Wednesday, October 20, 2021

Simple Rule Based Text Classification using Orange Data Mining

Typically, we use a lot of algorithms to perform simple classification such as Decision Trees, SVM, Naive Bayes, Logistic Regression etc. How about using simple rules. For example, can't we look at some specific words to define whether it is a positive or negative sentiment? how about words like pathetic, worst, poor for negative sentiments whereas great, fabulous, superb for positive. 

Let us see how we can use the Orange Data Mining tool to achieve the above objective. Following is the Orange Data Mining flow.


You can download the workflow from the Github  dineshasanka/Orange-Data-Mining---Text-Analyitics (github.com) 

Let us explain the package one by one. 
1. From the import documents, a film review data set was extracted.
2. Preprocess Text was used to convert the texts to lowercase and remove some URLs. 
3. Statistics is the key component in this package. This is where you identify the keywords.


4. Then using two aggregate columns were used to create two POS and NEG columns. This will sum the two positive and negative sentiments to the two columns.


5. As of now this is the dataset. 


6. Two feature constructors were introduced. If you are good at Python you can use a Python Script component. 

7. Depending on the positive and negative keywords, we can introduce a new column predicted as follows. 


8. Let us look at the confusion matrix from Pivot table control.

You can see that it has 70% accuracy while more than 85% accuracy for negative sentiments. 

This technique shows that you do not need to rely on complex algorithms but a simple technique will give you more accuracy. 

Wednesday, October 6, 2021

Time Series CheatSheet - v 9.0

 This time we will have few more updates to the Time Series cheat sheet that can be seen from the following image. Image size was changed as we are covering few more components and you can get to the original file from Time-Series-Cheat-Sheet


Improvements in v 9.0.

1. Bench-Mark dataset
Few research papers have indicated that there are benchmark datasets for Time Series analysis so those are included. 

2. Timestamp Attribute Derivation
During the analysis of datasets, it was found that there are some datasets that do not have an explicit timestamp attribute. In some datasets, the time attribute is distributed between multiple columns such as year, month, day, hour, minute etc. In addition, sometimes there are no timestamp attributes and that has to be generated. 

3. Time Series Reconstruction
By looking at few more research papers, we identified that there are many different techniques of Time Series Reconstruction. 

Monday, October 4, 2021

Orange Data Mining - Text Processing

During the last few blog posts, we have discussed how Image processing can be used for different purposes using the popular Orange Data Mining tool. Now let us move our discussions to Text analytics another one of the complex data sources. 
Text tab in the Orange Data Mining tool is not available by default and that has to be added to the tool by updating the add-in. From time to time, there can be updates that have to be added periodically. 

Now let us see what are the basic functions of the Orange Data Mining for Text Analytics.


Today let us use a few and important features for Text Mining. As you can see, there are existing corpora (Text datasets) for you to use as shown below. 


Further, if you have proper access, you can extract data from NY Times, Pubmed, Twitter etc. 

Let us use the customized dataset to perform simple text preprocessing technique. By using, Import Documents widget.  IMDB review dataset was used as it has 2000 positive and negative reviews. You can download the relevant Orange Data Mining workflows from this link. https://github.com/dineshasanka/Orange-Data-Mining---Text-Analyitics.git and following the entire workflow.


After the 2000 documents are imported, we need to perform some preprocessing techniques in order to clean data. This is something very important task in text analytics as you tend to see a lot of issues with the text due to the free form nature of text data. 


The above configuration covers basic preprocessing techniques, Tokenization, filtering and transformation. In this example, we have not used other available preprocessing techniques such as N-Gram, normalization and POS tag. 
Tokenization will decide how would to separate words from the sentences and the filter will decide to remove unnecessary words. Since we have used English stopwords and customized text to remove the non-semantic words. The basic transformation was done by removing URLs and converting the text to lowercase. 
Now you can visualize the words in the word cloud as shown in the following screen.


Apart from word cloud analysis, you can perform simple statistics on your text documents using the Statistics widgets. 

Then you can view the data either from a data table or from the feature statistics.  

Saturday, October 2, 2021

Article: Text Classification in Azure Machine Learning using Word Vector


WEKA or Waikato Environment for Knowledge Analysis developed at the University of Waikato, New Zealand, is a good tool to perform text Information Retrieval as it has a lot of features like Term Frequency (TF). Inverse Document Frequency (IDF), NGram Tokenization, Stopwords, Stemming, Document Length. 

This latest article Text Classification in Azure Machine Learning using Word Vectors describes how the output of word vectors in weka can be used in Azure Machine learning in order to process better classification.

Following is the table of content for the article series on Azure Machine Learning.

Introduction to Azure Machine Learning using Azure ML Studio
Data Cleansing in Azure Machine Learning
Prediction in Azure Machine Learning
Feature Selection in Azure Machine Learning
Data Reduction Technique: Principal Component Analysis in Azure Machine Learning
Prediction with Regression in Azure Machine Learning
Prediction with Classification in Azure Machine Learning
Comparing models in Azure Machine Learning
Cross Validation in Azure Machine Learning
Clustering in Azure Machine Learning
Tune Model Hyperparameters for Azure Machine Learning models
Time Series Anomaly Detection in Azure Machine Learning
Designing Recommender Systems in Azure Machine Learning
Language Detection in Azure Machine Learning with basic Text Analytics Techniques
Azure Machine Learning: Named Entity Recognition in Text Analytics
Filter based Feature Selection in Text Analytics
Latent Dirichlet Allocation in Text Analytics
Recommender Systems for Customer Reviews
AutoML in Azure Machine Learning
AutoML in Azure Machine Learning for Regression and Time Series
Building Ensemble Classifiers in Azure Machine Learning
Text Classification in Azure Machine Learning using Word Vectors

Thursday, September 23, 2021

Recovering Deleted Data in SQL Server Databases


How many times you have come across unexpected data deletion in the production environment as looking for data costly tools, to recover your data. If you cannot recover your data, there can be situations where you will be thrown out of the business. 

How do you plan for these accidental or deliberate data deletions? Point in Time Recovery with SQL Server is the option that allows you to recover the deleted data. However, you need to better understanding SQL Server Recovery Models and Transaction Log Use in order to enable Point in Time Recovery. 

This is an important configuration that needs to be done and no point complaining later. 

Tuesday, September 21, 2021

Article : Building Ensemble Classifiers in Azure Machine Learning

A new article of the series, Building Ensemble Classifiers in Azure Machine Learning that discusses how to combine multiple classifiers. 

In ensemble Classifiers, we will look at how to perform predictions using multiple classification techniques so that it can produce better models with higher accuracy or they can avoid overfitting. This is equivalent to a patient that is referring multiple specialist doctors to diagnosis a disease rather than relies on one doctor.


The complete experiment can be found at Ensemble Classification | Azure AI Gallery 

Introduction to Azure Machine Learning using Azure ML Studio
Data Cleansing in Azure Machine Learning
Prediction in Azure Machine Learning
Feature Selection in Azure Machine Learning
Data Reduction Technique: Principal Component Analysis in Azure Machine Learning
Prediction with Regression in Azure Machine Learning
Prediction with Classification in Azure Machine Learning
Comparing models in Azure Machine Learning
Cross Validation in Azure Machine Learning
Clustering in Azure Machine Learning
Tune Model Hyperparameters for Azure Machine Learning models
Time Series Anomaly Detection in Azure Machine Learning
Designing Recommender Systems in Azure Machine Learning
Language Detection in Azure Machine Learning with basic Text Analytics Techniques
Azure Machine Learning: Named Entity Recognition in Text Analytics
Filter based Feature Selection in Text Analytics
Latent Dirichlet Allocation in Text Analytics
Recommender Systems for Customer Reviews
AutoML in Azure Machine Learning
AutoML in Azure Machine Learning for Regression and Time Series
Building Ensemble Classifiers in Azure Machine Learning


Thursday, September 16, 2021

Grouping the Flags - Image Processing using Orange


If you look at different flags of countries, you would think that some flags look similar. This post is to explain how Orange Data Mining Tool can be used in order to cluster images into groups. You can get the dataset and Orage Package in ImageProcessing-Orange (github.com).

This is a simple Data Mining Package, this will show that how easily you can perform image processing in Orange. 


Let us see how each cluster so that we can see how the grouping is done. 

The following does not have all the clusters as it has only the distinguished clusters. 

Cluster 2 


Cluster 3

Cluster 9


Cluster 10

Though this was done for fun, you can how the Orange tool can be used to determine clusters of images.