Contrasting and comparing are part of data analysis to make vital decisions. A violin chart integrated with Box Plot is one of the charts that can be used to compare data. Let us see how we can utilize the Orange data mining tool to compare data using the Violin chart.
Let us assume that the following is the dataset that we need to compare.
In this dataset, there are five variables to compare. If you simply use a Violin chart without any preprocessing, you cannot compare charts in one chart. Therefore, there are a few preprocessing tasks to be done.
In the above preprocessing tasks, separate processing tasks are used for each variable. Select Columns, Edit Domain, and Feature Constructor are used. You can download the Orange workflow at ODM/Violine-Blog.ows at main · dineshasanka/ODM (github.com)
Finally, all data flows are connected and then used to Violin Plot, as shown below.
Now you can see from the above chart, it is easily can be compared. In the above example, X1 has higher values.
About five years ago, the Koobiyo teledrama was very popular due to the uncharacteristic nature of the teledrama. It was a political teledrama, one reason the teledrama became popular. However, this post is not to discuss the political side of the tele drama but to discuss the data science side of it.
Jehan, the main character of this teledrama, has the idea of building a tool to predict the future problems of people. He uses decision tree architecture to achieve this and explains his idea to his companion, Priyantha as shown in the below video. Watch from the 540th second.
So his idea is very clear. By using data like Gender, Marital Status, Professional Qualification, Parents' details, Friends' details, etc.
After building the predictive software, he presents his case to his good friend Hiruni and his developer too joins the discussion in the following video. Watch from the 40th second.
After observing the work done by Jehan, Hiruni was impressed, but she had a very vital question to ask. "Why do you think people will buy this". Jehan was a little perplexed by the question, and he stressed that this is the software that everyone will have at their fingertips. Obviously, people know their problems they need solutions, not to suffer from their own problems.
This is something important to us as data scientists. We are very good at technical details, but we need to understand the solution part of the tool. Remember, people need a solution to their problem not a technical tool.
Then Hiruni provide a solution to Jehan and asked him to provide this to a human resource person to predict the future problems of its own employees.
Then the solution can be viewed in the 21st second of the following video.
In the live demo, Jehan proves that it is important to select the best people for the organization from this software. It is clear how we should think from the business point of view rather than focusing on technical aspect mainly. As a data scientist, we need to look at the solution side of it.
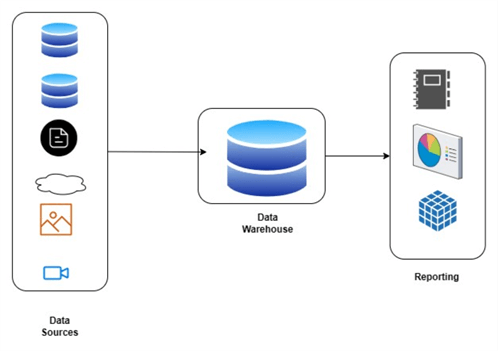
I started another article series at www.mssqltips.com on data warehousing. Even though there are many tools to build data warehouses, I still find there is a lack of conceptual knowledge in the community. So trying to cover that gap. So, read this What is a Data Warehouse? article and send your comments.