Translate

Saturday, October 31, 2020

Do You Know - Big Data Facts


Not sure how accurate these facts are, but seems to be interesting. 

1. Every two days we create as much information as we did from the beginning of time until 2003. 

2. Over 90% of all the data in the world was created in the past 2 years. 

3. By the end of the year 2020, digital information will be grown to 40 zettabytes. source

4. The total amount of data being captured and stored by industry doubles every 1.2 years. source

5. Every minute we send 204 million emails, generate 1.8 million Facebooks likes, send 278 thousand tweets, and upload 200,000 photos to Facebook. source

6. Google processes on average over 40 thousand search queries per second, making it over 1.5 billion in a single day. source 

7. Around 100 hours of video are uploaded to Youtube every minute and it would take around 15 years to watch every video uploaded by users in one day. source

8. If you burned all of the data created in just one day on DVDs, you could stack them on top each other and reach the moon, Twice. source 

9. AT&T is thought to hold the world largest volume of data in one unique database, its phone records database is 312 terabytes in size, and contains almost 2 trillions rows. source

10. 570 new websites spring into existence every minute of every day. source

11. Today's data centres occupy an area of land equal in size to almost 6,000 football fields. source 

12. The NSA is thought to analyse 1.6% of all global internet traffic - around 30 petabytes every day. source

13. The Value of the Hadoop market is expected to soar from $2 billion in 2013 to $ 50 billion by 2020. source

14. The number of bits of information stored in the digital universe is thought to have exceeded the number of stars in the physical universe in 2007. source

15. The boom of the internet of things will mean that the amount of devices connected to the internet will rise to 50 billion by 2020. source

16. 12 million RFID tags used to capture data and track movement of objects in the physical world had been sold in by 2011. by 2021 it is estimated that number will have risen to 209 billion as the internet of things takes off. source

Friday, October 30, 2020

Prediction with Classification in Azure Machine Learning

Classification is a popular technique used in Machine Learning. My latest article at sqlshack, describe different Classification techniques in Azure Machine Learning and different evaluation parameters that can be used in the Classification in Azure Machine Learning. 

Read the article here

Thursday, October 29, 2020

Key Reasons for Majority Females to be QA Engineers or BA in Sri Lankan Software Industry

Being in the Sri Lankan Software Industry for more than 20 years, this topic was something very obvious. Then I proposed this as a research topic to one of my students and were able to conduct research on this. 

In this research, we target two groups. Females in QA/BA professionals and Females in Developer professionals. 


Ideally, we should have collected data from male professional, but could not process due to the time limitations. 
We considered different qualifications of Professionals, experience, and other demographic details such as age, marital status etc. Further, we considered different project types and different scales of projects in different companies. 

We used Azure Machine Learning and by evaluating multiple classification techniques, Two-Class SVM is the best model. The following figure shows the accuracies for each model. We could have evaluated other evaluation parameters such as F1, MCC 


You might be much interested in the outcome of this research rather than the methodology. 

  1. In most of the professions, they were told that QA/BA jobs are much suited for females 
  2. Most of the females professional under the impression that QA/BA jobs are lesser stress than developer jobs.
  3. They assume that they can attend to their family matters being in the QA/BA jobs. 
  4. Few of the females professional believes that software development is too technical for females. 
  5. Developers needs long hours of work which is not cultural for females in Sri Lankan context. 
These are surveys data. you may have different ideas. Let me know your thoughts on this. 


Tuesday, October 27, 2020

Orange Image Analysis - Famous Paintings

After performing the clustering technique on a simple image data set in the previous blog post , now let us do clustering on world-famous paintings. 

World famous paintings

My data set includes images from world-famous artists such as Leonardo Da VinciVincent van GoghMichelangeloÉdouard Manet, Claude MonetRaphael and some famous paintings from Kandy. Let us use Orange to find any relations in these paintings.
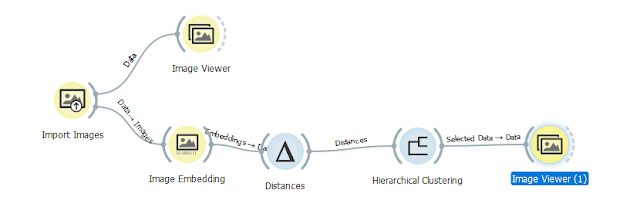
It is the same configuration in Orange like last time as shown in the below Figure.

In this configuration, we will be using a different Embedder in Image Embedding. 

Image Embedding with Paintings

In this Embedder, we have used Painters. This is the model which is specially created for the Painters. 

In the Hierarchical Clustering, we can choose the different clusters from the height and let us see how these clusters were done. 


You will see that Kandy, Vincent Van Gogh paintings are clustered together. 
This is Vincent van Gogh cluster.


Though you will Monet's paintings in this cluster, it is closer to van Gogh's paintings. 

Following is the cluster for paintings in Kandy. 


Most of the clusters are well defined and you do not see more than two artists in any cluster. 
The following is the only cluster that can be considered as high error. 


In this cluster, you will see you have both Michelangelo's and Leonardo da Vinci paintings. However, I don't think you can blame orange on these clustering as these have similar paintings. 


Sunday, October 25, 2020

Image Analysis - Orange - Clustering - Key Findings I

After doing the presentation on Image Analysis from Orange at the last Sri Lanka Data Community, I thought of explaining a few interesting findings from a few upcoming of blog posts. 

Let us look at CLustering techniques. As you know clustering is natural grouping. Let us look at images in a folder without any grouping. You will see some data set that was download from the internet by a third party so that this dataset is semi-unbias data set. 

Sample Image set Orange Image Processing
Sample Image Set


Then in Orange, we have done the following configuration in order to make clustering.

Configuring Clustering of Image Processing in Orange
Configuring of Clustering in Orange Tool for Image Processing


In the Image Embedding, Inception V3 is used and Embedder and Cosine Distance is used as the distance measurement in Distances control.

Now let us look at natural clustering outcomes by selecting different clusters in Hierarchical Clustering.

Birds Cluster

Here is another cluster with Flowers. 

Flower Cluster


There are more some interesting clusters like below. 

So this is a very interesting grouping. Though not all the groups have the same images, this will provide you with an interesting image clustering. 


Saturday, October 24, 2020

Data Modeling Tools - Draw.IO

If you are involving in Data Models, it handy to use a modelling tool. If you are a SQL Server favoured permission, you might be using Database diagram option in the SQL Server. However, there are tailor-made tools for data modelling such as erwin Data Modeler, ER/Studio or Draw.IO.

This article brings you 19 different tools that can be used. Draw.IO is one of the preferred tools as it is free can be shared between users/designers much easier. Nowadays, it is not only one person needs to worry about the design but many other stakeholders.

in Draw.IO you can save your models at any places as below. 

At https://app.diagrams.net/ you can create your models. 


Wednesday, October 21, 2020

DR in Real World Incidents

When it comes to computer systems, Disaster Recovery is an important concept but at most of the times, we neglect the most important conceptual points. Those will lead to a lot of damages. The idea of this blog post is to learn from mistakes of real-world incidents that can be used as learnings to the Computer Systems.

Titanic (1912), what a romantic story. However, it is not that romantic when you consider Disaster Recovery (DR) concepts. When the Titanic was designed and built, they boasted that it is a ship that is practically unsinkable.  In that mindset, they did not have enough lifeboats this causes many deaths in the incident. They had only 20 lifeboats which were sufficient for 1300 people out of 3500 that were travelling. This is a basic mistake when it comes to disaster recovery. When you are designing a DR system, consideration should be the scale of Impact NOT the Probability of the Event. Though the probability of the ship sinking is small, you have to plan DR considering the impact if the event occurs. In the case of IT systems, we need to look at from the same line of thought. 


Next, let us look at somewhat very recent incident. The incident is the 
Fukushima Daiichi nuclear disaster that happened in 2011, March. The Fukushima Daiichi Nuclear Power Plant comprised six separate boiling water reactors out of which three were operating on that day where the earthquake occurred. As soon as the earthquake, those Reactors automatically shut down. As the reactors were now unable to generate power to run their own coolant pumpsas a DR mechanism, emergency diesel generators came online,  to power electronics and coolant systems. However, the tsunami came in after the earthquake which resulted shut down of diesel generators.  In the designed, there was another DR option DC power./ DC power was lost on Units 1 and 2 due to flooding, while some DC power from batteries remained available on Unit 3. After all the DR options failed, then the inevitable disaster occurred. Now they have built a tsunami wall in the area in order to control tsunami, another DR option. Learning from this strategy is that, there is no limit for disaster implementation, there are spaces for improvement all the time. 

The third incident is coming from Bhopal, India. In 1969 United Carbide, USA started their factory in Bhopal. At the time of opening, this factory was equipped with the latest technologies and included lot of DR mechanisms such as extra storage for Methyl Iso-cyanide (MIC),  Vent Gas scrubber to detoxified gas, Flare Tower to burn the gas etc. However, over time due to the cost-cutting, these DR techniques were not maintained and ultimately many of the monitoring systems were not working so that operators were not caring about the meter reading. All these things have resulted with the lives of more than 25,000 people in December 1984. So we have a few learning outcomes with the Bhopal tragedy. We should not compromise DR in the name of cost-cutting, we need to maintain DR systems and importantly we need to rehearsal for DR systems. 

In 2000, November, in Kapran, Austria 150 people died due to fire in a train. During the incident, passengers did not have the options to inform the necessary people outside. Furthermore, there were no smoke detectors etc to stop the fire. After the incident, when authorities were questioned they had an interesting reason. According to them, they haven't taken any of the DR precautions since there were no previous incidents before. For DR history does not matter. A new incident can always occur. 

Another incident that results in Disastor is collapsing of New World Hotel in Singapore. In this incident, after the building was built there were many changes had happened. They have introduced new AC plants, new machinery. With these changes, they had not looked into design again. In the case of the Computer system, we all know that systems are evolving. According to the system functionality, you DR systems should be modified accordingly. 

These real-world incidents have resulted with many loss of lives. Though Computer systems may not result in looking of that many lives, it is essential to focus more on the DR system in order to maintain better systems. 

Monday, October 19, 2020

Four Security Learnings from the Lockerby Bombing

On 1988 December 21st, PAN AM flight to New York from Heathrow blasted in the high skies of Lockerby, Scotland killing 270 people. Though there were a lot of political issues and a lot of conspiracy theories behind this incident, let us discuss the learning of this unfortunate incident with the focus on Security concepts. 

Blasted PAM AM 103 in Lockerby


According to the official investigation, the bomb was passed to the aeroplane from Malta. This bomb planted luggage was passed to counters just before the closing of the aeroplane gate. Since there is a lack of time to check, airport officials have ignored the security protocols.

#Learning 1: Your customers might be pushing you to ignore the security policies citing the business needs. However, security should come first.


Next, the bomb was transferred to an aeroplane in Frankfurt. Since this is a plastic bomb, you need a colour monitor was required to detect. The colour monitor was not in operation for many days and the bomb was passed through the Frankfurt airport safely. 

#Learning 2: Many security implementations are initiated but not maintained. 


Finally, at the Heathrow airport, all luggages from Frankfurt were not checked as Heathrow official assumed that these luggages were well checked at the Frankfurt. This was done to avoid plane delayed considering there were a large number of passengers during the Christmas season. So the planted bomb passed into the third plane dispute there were warnings before. 

#Learning 3: Security should be placed in higher priority than other business needs. 

#Learning 4: When multiple security implementations are inplaced, they should be independent of others. One security implementation should not depend on others.

All these security lapses accounted for 270 lives including 11 people who were the citizens of Lockerby who had nothing do with the said plane. These lives could have saved if the basic concepts of security met during the entire journey of the plane. 

Friday, October 16, 2020

Orange, Color or Fruit or…?


Orange is a tool for data visualization and data mining. It has a variety of features to perform predictive analytics. This session will discuss Image Analytics in Orange tool. We will be discussing Image Clustering, Image Classification techniques with Orange. 


Join me on 21st October 2020 at 430 PM SL Time to discuss the Image Analytics in Orange.
Sri Lankan Data Community October 2020 Online Meetup  https://www.meetup.com/en-AU/sldatacommunity/events/273971825/ 

Time Series - Cheat Sheet

Time Series Analysis is one of the popular machine learning technique that is used. Out of existing machine learning, such as classification, Clustering, Association and Regression, Time Series has its own difficulties. 

Time Series analysis needs to analyse Trend, Seasonal and Cross prediction aspects in a time series. 

This sheet shows the aspects of Time Series. This is version 2 and will update with the future improvements.

Time Series Cheat Sheet Version 2


Thursday, October 15, 2020

Think about Data Volume in Vs of Data

If you are working and learning about data, pretty much sure that you have come across Vs for properties of data. Some are saying it is 3Vs and for some, it is 4Vs or 5 Vs. Here is an image that shows the 10Vs of properties data. 

10vs of Properties of Data


Let us stop arguing what is the actual number of Vs and let me share an interesting story on Volume, one V which no one will dispute. 

When I started my career as an implementation officer way back in 25 years ago things were a little different from what you have today. I was working for a software development company that was supporting multiple clients around the country that consists of hotels, plantations, factories etc.  Every year, I have a job to do. Once the accounts year ended or coming close to an end, these systems do not have enough disk space for the next year. So I have to visit every client's place as there is no remote connectivity support. Then I will print all the detailed reports that will take hours and hours and file them. Then take backups of the existing data and delete data so that next year's work can start.

Now think about data analysis. As you imagine nothing much of analysis can be done with one year's of data. At that time we were boasting about our reports that have the ability to compare revenue or expenses of this month to last month. 25 years ago that is surely a cracking feature to have. However, one of our clients who happens to be a Hotel said, there is no point in comparing this month to last month. In the case of the hotel, it is a seasonal business so they need to compare this month's values with last year's same month not last month. Our systems are not designed to accommodate two years of data, so we had to redesign our system.

On the other hand, our office server hard disk was upgraded to 1 GB. No, it is not a typo and you read it correctly, it is 1 GB.

1GB now and then

Comparison of 1 GB now and Then

These stories tell you how precious was the storage back then. With that IT systems are more used for operational activities rather than analytical activities. Increase in the storage technologies has paved the way for different types of analytics such as Diagnostics, Predictive and Prescriptive. The above picture tells us a story of thousand words on how the storage technogies have increased over the years.

Tuesday, October 13, 2020

Row Level Security went Wrong

It was an organization where there had sales representatives around the country. It was asked to developed an analytical system to so that strategic management can get a holistic view of the business. 

ETL was developed to extract data from multiple sales representative database and was loaded into the central database at the head office. Then the OLAP cube was built to further analysis. Management was very happy and they wanted to deploy this feature to the sales representative so that they can do their own analysis. Without much thought, we were carried away with the success and access was provided to the sales representative. 

That happiness was ended after two months with a call from the client. Since we have not implemented Row Level Security in OLAP Cube, sales representatives were able to see other sales representatives data. Previously, they were working on their own boundary and they were unable to see others' data. With the OLAP cube access now they can see the others' data. One sales representative had accessed someone else's data and he has obtained, is revival reps customers details with the markup values. Then the rest is you can imagine. He has gone to all those clients and offered better markup and got all the business. 

Immediately, the access of the sales representatives were revoked until Row Level Security (RLS) was implemented. After careful consideration, RLS was implemented so that these types of issues will not happen again. However, the damage is done along with the reputation!!

Thursday, October 8, 2020

What is the Best Database

If someone asks you "What is the best database", what is your answer. Answers might be different depending on your job role, whether you are a developer or a database administrator or client.

However, there is a ranking done for the database every month and the following is the latest ranking of databases. 


You can look at the rank of all the 359 databases here. According to this ranking, first six databases, Oracle, MySQL, Microsoft SQL Server, PostgreSQL, MongoDB, IBM BD2 are remaining the same compare to the last year.  If you look at the entire list you will find that Azure SQL Server Database is a major improvement. Azure SQL Server Database ranked 17 this year where it was 25th in last year.  

Let us look at the trending of these databases. 


You can see that MySQL and Oracle are running closers whereas PostgreSQL and MongoDB are running a close encounter. 
This does not say one database is better than others. This ranking based on various factors, such as Number of mentions of the system on websites, Frequency of technical discussions about the system, Number of job offers, in which the system is mentioned, Number of profiles in professional networks, in which the system is mentioned, and Relevance in social networks etc. You can look at the complete ranking parameters here.

Monday, October 5, 2020

Data Mining in SQL Server

Data Mining or Prediction has become a buzz word not only in academia but also in the industry as well. SQL Server is providing a rich set of algorithms to support data Mining for a long time. However, most of these features are not used due to many reasons. The following article series which I completed at sqlshack provides details of how to use data mining in SQL Server. The major important advantage is that you can use the existing data in the SQL Server with the Data Mining itself. Further, you have to option of using MS BI family for data mining. 

Enjoy the article series here. 

Introduction to SQL Server Data Mining
Naive Bayes Prediction in SQL Server
Microsoft Decision Trees in SQL Server
Microsoft Time Series in SQL Server
Association Rule Mining in SQL Server
Microsoft Clustering in SQL Server
Microsoft Linear Regression in SQL Server
Implement Artificial Neural Networks (ANNs) in SQL Server
Implementing Sequence Clustering in SQL Server
Measuring the Accuracy in Data Mining in SQL Server
Data Mining Query in SSIS
Text Mining in SQL Server

40 Kms Journey to Create an Index

 A client called and they had a slow system. Their complain was very simple.

They are a garment production company. Those garment items are flowing in a belt and there are workers who have a task of swiping the picked item to the bar code reader. Their complaint was that it takes more than 5 secs to read one production item. Their experience is that at the start of the season, this was around 1-2 seconds. When this is taking more than 5 seconds, they archived the data to solve the issue. However, they are looking at a permanent solution as this has been troubling them for a while.  

Well, by the looks of it is very obvious that issue is an index. However, it was difficult to convince the customer, mainly client was not able to identify what is the index he should apply. Well, then it is decided to make the physical appearance by driving 40 kilometres.

At the client site, it took only ten minutes to find the troublesome query. SQL Profiler was initiated while asking the users to continue with the normal operations. The query was identified from the profiler and verified it by running it in the SQL Server Management Studio as in the query plan CX_PACKET was identified.

Then the index was applied to cover the where clause condition as it had only one column in the where clause. Well, 5 seconds was reduced to almost zero seconds making users very happy as they can earn more as an extra bonus.

The index is the most common problem in the database systems. However, the art of the index is identifying and creating them. It is something that needs a bit of experience. 

If you need more details on Index read this article. Further, if you need more details on CXPACKET, this is the article. 

Sunday, October 4, 2020

Recover from a Data Disaster – Point in Time Recovery Method

If you are a database administrator, you will never know when your database hit a disaster. When the disaster hit your database, you will be in a panic mode and you will take action which you won't take in modest conditions. However, we need to plan for a disaster. This article provides you with the importance of Point in Time Recovery Method in order to recover data.

This is a fantastic feature in databases but you will not realize how valuable this until you come across this situation. Leaving describing these features to separate time, let us first look at two cases. Incidentally, these two incidents occurred in one organization and moreover for one database but at different times.

Incident #1:  A developer was connected to both production and development instances of databases from one SQL Server Management Studio (SSMS) instance. If you have work with SSMS, you would understand how risky this is. If not, this incident tells you how risky it is. The DBA thinking that she is working on the developer instance has deleted data in a customer table in Production.

Incident #2: In the same organization, they decided to increase the column length to 50 from 15. This column is a critical column to the business. They increased the size of the column using the design view from a table. Guess what, before typing the 0, after removing the 1 the user has saved the designed, which had resulted in the truncation of the table column to 5 from 15 with a data loss!!

Action: In both cases, we were to help. The first question was “What is the recovery model?” if it is Simple, then nothing that we could do as Simple recovery model does not keep the transaction log history and nothing can be recovered. In these scenarios, the recovery model is Full means that we can recover data to a point of time. In this mechanism, we can recover to a given time. So, we got the full back up of database and restored to a different database instance with the recovery option on. Then we got a log backup and restored on top of the previously restored database with specifying a time which is just before the disaster recovery. After the database is restored fully, customer table and the other tables were transferred to the production database.

Lesson Learnt:
  • ·  Never connect to multiple databases instances from SSMS. Especially, with production and other database instances.
  • ·  Never use the SSMS designer, to modify the database schema. Always use scripting for schema design changes. 
  • ·  Always, use the Full recovery model for production.

  • If you need more details, read the article written by me at sqlshack. Further, you can use Log shipping to avoid data disasters as discussed in the latest article

Friday, October 2, 2020

Unknown to Known OR Technical Thinking to Business Thinking

This story is a real story that happened back in 2008. I was working in Project for UK client whose prime business is producing advertisements. 

Let me explain the business case first of all. They had few studios in the UK where they have artists working in these studios. They had teams and each team has one or many sales representatives. Sales representatives were the people who bridged between artists and their clients. Sales Reps goes to the clients and get their requirements. Then he comes to his team and explains the requirements. Then the artist comes up with different artwork. Then again busy sales reps go to the clients for their reviews. If he is lucky enough, the trip will end up where the client has selected one artwork with few reviews. However, until the client selects an artwork, the poor sales representative has to run over and over again. 

Management has a problem to solve. 


What are the qualifications of artist that makes the artwork to select? 

By answering this question, management looking at fixing the issue in two ways. 

1. Train the existing artists with the relevant qualification. 

2. When hiring new artists, make sure they have these qualifications. 

Then, I was one member to provide them with a solution with. Now, we required two sets of data, Production & HR which were developed by two different vendors with different technologies and not under any maintenance agreement. If I remember the numbers, there were 121 artists in the production database that needs to be matched in the HR system. 

Obviously, the matching key would be Employee ID or Employee Number. Unfortunately, both systems did not have the same global key to match. Then we decided to match the artist with the Employee Name. 

out of 121 artists, 101 artists did not give us any trouble as they were exactly matched. out of balance 20 artists, 17 of artist we were able to match with Fuzzy Lookup. This is due to the fact in of the system, there were spaces and dots in the names which were not in the other system. However, after spending some quality time with different configurations of Confidence and Similarity levels in Fuzzy Lookup Configurations, we were able to crack those 17 artists. Now we have three artists left where we could not match. 

Further analysis shows that these artists were ladies! Any guesses??

Yes, most of you are correct. After their marriage, they have changed their names and in one system you have the option of changing the name in another system you do not have an option t change the name. (You know what, I have been telling this story for more than 12 years now, every time it is the male who provides the correct reason for this mismatch. Will leave that analysis for a different date). 

Since we know the reason for the non-matching for these three artists, we tagged them to UNKNOWN category which is what is our typical technical approach in reporting or in data warehousing.  So we thought we crack the Artists "problem" and we were over the moon. So in all of our fancy reports and dashboards, whether it is Sales Rep wise, Artist Groups wise, Studio wise, all of these reports shows three artists work under UNKNOWN category. During our presentation, we presented these reports and dashboards with our head is high, needless to say proudly. We never thought that our proud would be short-lived. 

During the question time, Finance Manager who was a lady very quietly asked "guys, who are these unknowns". As you can imagine, I was ready with the answer. I had byhearted those ladies names, as this was expected question. I proudly said those names and the reason for not matching them. Further, I took the opportunity to explain our Fuzzy lookup techniques boasting our technical capabilities. 

She first acknowledged our capabilities, "great work guys", but then came the killer questions. 

"If you know these ladies names, how can you call them unknowns"

I was looking like a tiger without nails. Though they accept our project, that question has left me to thrive for a solution. I came up with a very simple solution. I used type 3 slowly changing dimension design. I introduced a simple table, where you have two columns with the previous name and current name. 

So the final solution was 

 1. Perform a simple lookup

 2. Perform a fuzzy lookup for non-matching names,

3. Lookup new table and find the previous name and perform a lookup.

Though we came up with a solution. This incident has changed our thinking ability. If you further analyse her question, business-wise we knew who these employees are, but technically we did not know them. In approach, we placed our technical knowledge over business knowledge. That was the clinical mistake we did. The lady with less technical knowledge was driven us for a technical solution to achieve success. 

Finally, I leave you with this great saying. 

"Whether you succeed or not is irrelevant, there is no such thing. Making your unknown known is the important thing"

Georgia O'Keeffe