Translate

Saturday, January 30, 2021

Rice, Politics and Time Series

This post is looking at identifying the Anomalies in Production of Rice in Sri Lanka using Time Series Anomaly detection. Further, this article stresses the point that outside environment conditions should be looked at when modelling with data as we cannot simply go by the technical parameters. We will be using Time Series Anomaly Detection in Azure Machine Learning. 

Source: https://thinkworth.wordpress.com/2016/12/30/rice-mafia-dudley-harrison-and-citizen-perera/


Rice has a great influence on Sri Lankan politics. If we go back to, 1953, the islandwide "hartal" as called by the Marxist opposition party due to the increase of rice kilo to 75 cents from 25 cents. From that point onwards, rice has a major impact in Sri Lankan politics. During the General Elections 1960 March, 1960 July, 1964, 1970 politics promises were revolved around Rice. There was the infamous political promise of "providing two kilos of rice, even bringing the rice from the moon"

Following is the one of the main slogan from the United Front camp who came to power in 1970 by defeating the Dudley Senanayake who alias as Father who gave rice ("බත් දුන් පියා")

අපේ අම්මා ලඟ එනවා - හාල් සේරු දෙක දෙනවා

Translate: When our leader /mother (Sirimavo Dias Bandaranayake) wins, we will give two kilos of rice.

On a side note, after winning the election and later in seven years, the slogan was changed to,

සීනි නැතුව තේ බොන්නම් - මිරිස් නැතුව හොදි කන්නම්

අපේ අම්මා කියනවනම් - පිදුරුවුනත් අපි කන්නම්

Translate: We will have tea without sugar and will have gravy without chillies. We will eat straw if our mother asks us to do so.

Having looked at the political background in Sri Lanka with respect to the rice, let us look at some data and let us try to identify some anomalies in Rice production in Sri Lanka over the years. 

We will be using Azure Machine Learning, Time Series Anomaly Detection Control to exploit the anomalies. You can find the experiment at https://gallery.azure.ai/Experiment/Anomaly-Detection-of-Sri-Lanka-Paddy-Production

Following is the Azure Machine learning experiment.


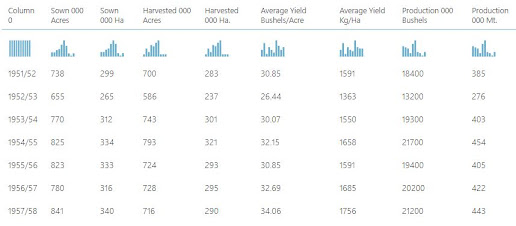
This is the dataset from http://www.statistics.gov.lk/. We have four parameters, season, Sown, Harvested, and Production with different units as shown in the below figure. 


Sown and Harvested do not have any anomalies and let us look at production anomalies. 1972, 1981, and 1984 there are anomalies and you will see that there are political changes in 1971 and 1980 and 1983. 

When looking at later years of rice production, we will see another anomaly in 1995. Any guess what is the reason? in 1994 August there was government change in Sri Lanka. One of the main election promises is to prie reduction of Bread from 4.50 to 3.50 and with that reduction, rice production has gone down.

This article emphasis that when time series modelling is done, we need to consider the environments without only considering the technical parameters. 

Source

https://archive.ceylontoday.lk/columns-more/670~~~Bread

http://www.statistics.gov.lk/Agriculture/StaticalInformation/PaddyStatistics/MahaSeasons1951-52-2014-2015

Friday, January 29, 2021

Time Series Cheat Sheet v4.0.0.0

This is the exercise of identifying the features of Time Series to facilitate the research of Design and Implementation a framework for Time Series Modelling using Multi-Agent Technologies. In the early stage of the research, we have identified many features for Time Series as shown below. 


In this version, we have included identification of Holidays and Public data sets such as Rainfall, Temperature etc. Data Normalization techniques and Outlier detection is also identified. 

Out of the existing techniques, we have extended the evaluation parameters and advanced techniques such as wavenets, and Graph Neural Networks. Further, to facilitate the operations, we have included the exit condition for the modelling and this enables us to detect the non-ending modelling. In addition, we have added the blocked techniques pre-configuration where users can explicitly define the techniques that should be modelled. 

In this research, we are looking into different tools to identify the features of the Time series. Until now we have analysed SQL Server and Azure services. Next month, we will be analysing Weka and Orange tools. 

SQL Server Workshops

Microsoft has provided a one-stop place for SQL Server Workshops at https://aka.ms/sqlworkshops. There are multiple categories of workshops such as SQL Server Data Platform,  Azure SQL, Programming, and Machine Learning and AI. All workshop material will be updated and you can follow them with your own pace. 
Watch the new video at Data Exposed here. 


Tuesday, January 26, 2021

Time Series in Azure Platform

Having started the research on the Time Series Modeling with Multi-Agent technologies, it was decided to study how time-series forecasting is implemented in the various tools. To identify the features and options in Time Series Modelling, we are releasing cheat sheet at the end of each month. Currently, we have released version 2.1 and expected to release version 4 end of this month.
We have selected SQL Server, Azure, Weka, Orange, Rapid Miner and AWS platform to study the features of Time Series Modeling. We have already released the cheat sheet for SQL Server and this is to release the cheat sheet for Azure as shown below. 


There are three components in Azure with respect to Time Series, Azure Machine Learning Service, Azure Machine Learning and Azure Time Series Insight. Azure Machine Learning Service has rich features such as the ability to connect to different calendars of different countries, connect to public data sources, different normalization techniques, cross-validation techniques, and rich set of evaluation parameters. Further, it has the ability to configure exit conditions as well, so that time series will run into never-ending loops. 

In Azure Machine Learning, there is another control call Time Series Anomaly detection to detect the anomalies in time series and has the ability to replace the anomalies. 

References
 

Monday, January 25, 2021

Time Series Anomaly Detection

Time Series has become one of the complex analysis and due to the introduction of IoT technologies, more and more time series are generated. Due to the velocity and volume of the time series, it is obvious that there will be a lot of anomalaties. Before making any insight into the time series it is essential to identify and replace the anomalies. In Azure Machine Learning there is a separate control named Time Series Anomaly Detection and from https://gallery.azure.ai/Experiment/Time-Series-Anomaly-Detection-3 you can download the Azure Machine Learning Experiment as well. This experiment shows how to detect the Time Series Anomalies and how to replace them with a technique called weighted Average of Previous and Next values. 

Stay tuned for the detailed article in the Time Series Anomaly Detection at SQLShack.

Friday, January 22, 2021

Required Employability Skills for the IT Industry In Sri Lanka

SLASSCOM has conducted a survey in 2018 in order to search the employability Skills for the IT industry in Sri Lanka and 28 companies participated in the survey. 


It is important that companies are looking for conceptual knowledge rather than tool experts. Further, most of the organizations are looking at soft skills such as Team Work, Attitude, verbal communication, etc. 
There are suggesting to both employers as well as for the Academic institutes to enhance the employability of the IR graduates. You can download the entire report https://slasscom.lk/wp-content/uploads/2019/10/Survey-on-employablility-skills-2018.pdf

Wednesday, January 20, 2021

Identifying Mask & Non-Mask Faces Using Orange

We have started a discussion of image processing techniques using Orange in a few blog posts previously. Let us look at another case that can be utilized in the Data Mining Tool Orange. In this time, we will look at more current problem, that is identifying the Mask & Non-Faces Using. 

As you know every prediction problem needs two solutions. First, it needs to build the model using the prediction techniques and then it needs to choose the higher accurate model and build the production application. 

Since this is a classification problem, we need a data set that is already classified. Following is the already classified images. 


PN: Today being the January 20th and the images of US president and Vice presidents images are also in the Non-Mask category. It is not a deliberate just a coincident. 

Let us build models from different classification techniques and find out what is the best technique.


In above, we have used five classification techniques, such as Naive Bayes, Random Forest, SVM, Neural Network, and Logistic Regression. Image Embedding is the special control available in Orange in order to perform the image analysis. We have included a Test and Score Control in order to verify the accuracy and other model parameters such as Precision, Recall and F1 measure etc. 


The Above results show that both Neural Network and Logistic Regression has 100% accuracy over the other techniques. 
Now let us move to the next step, which is the prediction part. 

Let us select some challenging images rather than selecting naive images for the prediction. 

The first image, yes the mouth is closed but with hands. The second image is very straight forward. Next two images are with a mask but with a transparent mask.


Let us look at the predictions. 


You will see that the image with the hand is correctly classified as the "Non-Mask" with the smiling image. Both the images with transparent images are also correctly classified as "Mask". This means that the prediction accuracy is 100%.

Sunday, January 17, 2021

Forecasting: Principles and Practice

There are a lot of practical implementation scenarios for Time Series forecasting such as sales forecasting, Demand forecasting, energy forecast etc. However, forecasting has a lot of mathematical background such as Statistical Modeling, Smoothing etc. Opensource book by  Rob J Hyndman and George Athanasopoulos at Monash University, Australia titled Forecasting: Principles and Practice is trying to fill the conceptual gap on the topic. 


Read the open source book at https://otexts.com/fpp3/index.html. The book covers, ARIMA Models, Regression models, Smoothing Techniques, and some practical examples using R. 

Friday, January 15, 2021

Time Series in Microsoft SQL Server

In a previous blog post, it was said that new research was initiated in order to design and develop a framework for time series using agent technology. 

In order to proceed with the research, it was decided to perform of feature analysis in various tools such as Microsoft SQL Server, Weka, Orange, Azure Machine Learning and Rapid Data Miner. Please comment if you have better tools. 

The following figure shows the components for Microsoft SQL Server 


Microsoft SQL Server supports three types of algorithms such as ARIMA, ARTxp and Mixed. ARTxP and Mixed are supported for the cross prediction. Further, ARTxP works well for short term predictions while the ARIMA will work for long term predictions.

Fast Fourier Series is used to detect the seasonality in SQL Server. Missing values will be identified only when there are multiple time series are presented. Mean, Constant, Previous and Same curvature are the techniques used to replace the missing values. 

Further, Microsoft SQL Server has the capability of using the predicted values for further predictions.  

References

Further, every month Cheatsheet for the Time Series will be released. Please let me know your thoughts. 

Thursday, January 14, 2021

Working in the Days of Corona

During these horrible days of Pandemics, most of us are forced to work on remote in order to keep away from COVID-19. This has led to increasing of Cloud spending as you can call it that there is a silver line in every dark cloud. 

A survey done by Flexera with 404 respondents in Europe and the USA shows that 49% of companies expect to increase information technology spending in 2021 with another 19% maintaining current levels.


No questions there that most organizations are impacted by the Work From Home

Further, this report shows that 54 % of organizations are planning to increase investments in work-from-home technologies. The figure also shows that 42 % of respondents are more willing to move to the cloud. 


To align with work from home, organizations will invest heavily on Remote workers as well. 


This survey discloses that there will be significant changes in IT spending across multiple technologies. Not surprisingly, spending on on-premises software, servers and data centres is dropping substantially while spending on SaaS and public cloud are increasing.

In 2021, what would be the challenging factors for IT? The major challenge is the Data Quality where 81% agreed. 

If you want to read the entire report, please proceed toinfo.flexera.com/

Monday, January 11, 2021

Another Confrontation for Indexes

Source: https://medium.com/analytics-vidhya/anatomy-index-in-relational-db-a1425f2d8a02

Indexes are seemed to be a never-ending topic. It is very difficult to convince application developers regarding the indexes. This is another instance of such. 

A user complained saying that they are getting continuous timeouts from their application during some processing. They insisted that it is a problem with the server resources. Since the server in question is housing more than 30 databases, that cannot be the reason. Further, even this application is working nicely with other queries but not with one particular query. When the requested for the particular query, it was not provided as the basic conclusion is that this is due to the server resources. Then the development team insisted to have a look on the database server which we did. At that time, server memory was 97% with CPU is at 4%. So, naturally, all were pointing the guns at server memory. The server memory is something that I have been elaborating to the users over the years, but with little success. It was very difficult to make them believe that database is a different animal is altogether. 

Finally, I got the table name even though I could not get the exact query. Well, the table has more than 300,000 records with one clustered index on the identity column. I was told that there process this table for each user. They were having around 1,500 users. That means the query in question, is doing table scans of 300,000 * 1,500. This table had more than 100+ columns but still, I couldn't make them satisfy that this an index problem. Then I offered them to delete a few records and check. Well, with fewer data their query worked nicely. Finally, they accepted it was an index issue, but for that more than 4-5 hrs were spent like the previous incident on the index.

Learnings from the incident

#1 - Increasing the hardware resource will not the first solution, there can be more other options than that. 

#2 - Don't be panic seeing that the server memory of a database server is hitting 90+%. That is how it is. You should worry if it is not. 

#3 - Index can do wonders for you only if you know the index concepts. 

If you need more details on Index read this article.

Saturday, January 9, 2021

SQL Server Analysis Service (SSAS) for Data Analysis


OLAP Databases are used to perform a much efficient data analysis in a data warehouse system. 

In the previous blog posts, we looked at basic concepts of data warehousing and SSIS options for ETL.
OLAP Analysis tools are connected to the data warehouse as shown in the above figure. 
In the Microsoft tools set, there are two tools to support OLAP databases, MDM Cubes and Tabular

Since SSAS is a different animal, we need to understand the hardware configurations required for SSAS in order to facilitate a better environment. In SSAS MDM cubes, we can create, KPI, Perspective and Hierarchies in order to provide better capabilities for the Data Analysis professionals. 
Apart from the functional properties, there are non-functional requirements such as OLAP database backup and monitoring

There are few other options to be covered and will update once those are published. 

List of articles for SSAS 

Ten Trends in Enterprise Database Technology

We might think that database technology is a matured technology and there are no trending prospects in the Database. Databases are more used to store data for the applications yet there are trending in the databases as well. 

1. Cloud Support for Databases

Cloud support for databases seems to be an undoubted trend for databases. If you look at the cloud databases, now cloud vendors are looking at supporting varieties of databases. AWS supports eleven databases which fall into seven types as shown below.

Detail at: https://aws.amazon.com/products/databases/?nc2=h_ql_prod_db

Microsoft Azure is putting up his hand to extend the different support for multiple databases as shown below. 


If you look at the Gartner Magic Quadrant  for Cloud Database Management Systems
you will see a lot of players are fighting with small margins. 


2. Time Series Databases

Though you can save data time column in a database, the database simply will not become a time series databases. There are databases such as InfluxDB which does more than storing date-time data. 

3. Graph Databases

Every data is not row-column format and you would like to represent data in graphical format using Graph DB. 

Go to this link for the other details of Trends in Database technology. 

Friday, January 8, 2021

Technology Predictions for 2021

We are into the year 2021 after spending the year 2020 almost entirely at home. What will be technical predictions this year?   

IEEE Computer Society has identified the predictions for the year 2021 as shown in the following figure. 


You will see that even technology predictions cannot live without ongoing Pandemics. Remote Workforce, Social distancing and virtual musical rehearsal are the topics that have emerged due to the ongoing COVID-19 situation.
Fake-news detection and the Election security / Social media controls have emerged from the current USA 2020 presidential elections and after incidents. 
Let us look at the impact and the likelihood of every option. 

Still the pandemic related topics are in the High Impact and High Likelihood quadrant with higher confidence.  

Monday, January 4, 2021

Cross Validation in Azure Machine Learning

Cross prediction is one of the most accurate evaluation technique that is used in Classification. This article describes how Cross Prediction can be done in Azure Machine Learning which is the latest of the Azure Machne Learning Article Series at SQLShack

This is how you compare models using Crosse Validation control in Azure Machine Learning.


Following is the Table of contents for the series until now. 

Introduction to Azure Machine Learning using Azure ML Studio

Data Cleansing in Azure Machine Learning

Prediction in Azure Machine Learning

Feature Selection in Azure Machine Learning

Data Reduction Technique: Principal Component Analysis in Azure Machine Learning

Prediction with Regression in Azure Machine Learning

Prediction with Classification in Azure Machine Learning

Comparing models in Azure Machine Learning

Cross Validation in Azure Machine Learning

Research - Outcome of the Extra Delivery in Cricket

One of the Famous No-Ball in the History of Cricket source: SBS

There is a common belief in cricket that extra delivery that is resulted in from No-Ball or Wide in an over will cost more than to the bowling team than to the batting team. This research paper is to verify the above statement. By employing data warehousing techniques, it was proved that there is no basis for this claim. 

You can visit the research paper at ResearchGate

This is the outcome of the extra delivery.


You will see that more than 70% of extra delivery has cost no runs or only one run. only 17% are accounted for boundaries. 

This was done in 2014 and cricket has evolved for half a decade. Therefore, this has to be verified against new data. IPL 2021 data will be used to further verification. Stay tuned!

Saturday, January 2, 2021

Time Series - Cheat Sheet v2.1

Time Series analysis is one of the most challenging machine learning technique. In order to start research on modelling times series with Multi-Agent techniques, it is essential to identify the different components in the Time Series. This diagram is no means completed and will be modified over time. This is the latest version done from draw.io. 

Further, Pre Validation components are included in this model.