Performance Monitor a.k.a perfmon is used to monitor different counters for different purposes. However, some counters are bit confusing. Process and Processor two misleading counters so thought of putting this note.
Processor
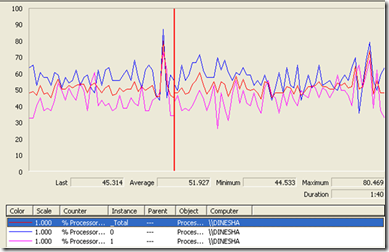
When adding processor object, you have _Total object and 0, 1 .. which are the processor number. Following the graph for _Total (Red) , 0 (Blue), 1 (Pink) objects for % Processor Time counters. ( Colors given in the graph for relevant counter)
In the above graph, you will see _Total is NOT the total of processer 0 and 1. But it is the average of them.
For example, let us say you have four processors of % Processor time of 20, 30, 50, and 80 and _Total count will be 45. i.e. (( 20 + 30 + 50 + 80 ) /4)
Process
While processor is the counter for your processors and Process is counter for each process you are executing right at the moment.
for example, if you wish to measure % processor for sqlserver, this is the measure you have to select.
in this also, you have the _Total counters. Unlike the Processor counter this counter is sum of all the processes INCLUDING idle processor.
From the above graph, you can see _Total counter value is through out 200.
So if you want to match Process and Process it will be following,
\Processor(0)\% Processor Time + \Processor(1)\% Processor Time + … All the other processors
= \Processor(_Total)\% Processor Time - \Process(Idle)\% Processor Time

