Translate

Thursday, December 31, 2020

Templates in Draw.IO

During a post around two months ago, we discussed that Draw.IO can be used to draw diagrams. Further to the discussed options, there are more than 100 templates that you can choose from Draw.io as shown below. 

Let us look at a few templates that you have in Draw.Io for Azure and AWS. 


The following figure is something that was designed using the Draw.IO using the native controls. 


Tuesday, December 29, 2020

Power BI End-To-End Features


Power BI is a Business analytics framework from Microsoft who is the leader in BI for the last 12 years according to the Gartner. Since we have a dynamic environment, we would love to know the capabilities and integration with this tool. 

The following link will take you to the end-to-end features of Power BI. 

https://static1.squarespace.com/static/5d28ebb6fbc5cd000177d261/t/5ede3952ea5e395a8580fbd2/1591621971557/PowerBIEndToEndDiagram_MelissaCoates.pdf

Wednesday, December 23, 2020

Creating your First Azure SQL Database

As the cloud has become something that you cannot avoid in the current technology race, it is important to understand what are the options you have to create a database in the Azure platform. As shown in the below image, there are different architectural options.


If you are interested in only the Azure cloud option, then you have the following options. 


To elaborate on how to create an Azure SQL database, here is the latest article at sqlshack. 

Wednesday, December 16, 2020

Defining Fuzzy Membership Function Using Box Plot

The membership function is the key component in fuzzy techniques. When fuzzy techniques are extended to the data warehouse, so that we can make decisions using fuzzy techniques in a data warehouse, it was identified that in the many implementations does no have the data-driven techniques to define fuzzy membership function. 

In this research paper, which is a research project on Investigation and Development for Fuzzy Data Warehouse, we have used the famous Box Plot technique to derive a fuzzy function. In this technique, we have mapped the fuzzy function parameters to the Box Plot parameters as shown below. 


In this technique, you can define three states or five states function where they have combined trigonometric and trapezoidal functions. The following are the three states membership function defined from the Box - Plot. 
Read the full research article. This research article has all the implementation details as well as the evaluation techniques. This article already has more than 10 citations ignoring the self-citations. 

Saturday, December 12, 2020

Data Warehouse in SQL Server

Data Warehouse is a comprehensive technology that provides the key people within an enterprise with access to any level of the required information within the enterprise. It is an enterprise-wide framework that permits the management of all enterprise information.

Let us see how we can utilise Microsoft technologies at varies stages of the Data Warehouse technologies. 


Let us look at how data design concepts can be used in Microsoft Technologies. First of all, you need to look at the infrastructure planning for a data warehouse. During the data warehouse design, it is important to include surrogate keys to dimension tables. Date dimensions is a special dimension that is used in data warehouse modelling. Historical data is an important aspect in a data warehouse that is used in Slowly Changing Dimensions (SCD).

Friday, December 11, 2020

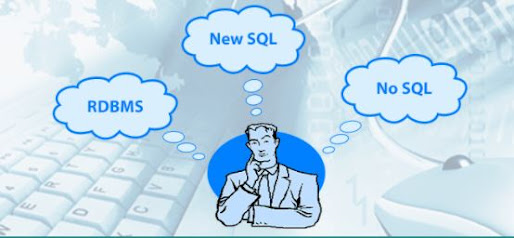
RDBMS -> NoSQL -> NewSQL

https://www.thepsi.com/rdbms-vs-nosql-vs-newsql-which-one-to-choose/

Nowadays there are a lot of data formats which needs to cater to your different needs, Relational Database Management systems are used for many years. Then came the NoSQL in order to support Horizontal calling and distributed computing. With NoSQL, you are losing the ACID properties in transactions. With the evolvement of technology and user needs, we are looking at distribution databases which have the features of ACID properties. This has lead to the new paradigm of NewSQL. 
Let us look at the comparisons as shown below. 

Source: https://medium.com/rabiprasadpadhy/google-spanner-a-newsql-journey-or-beginning-of-the-end-of-the-nosql-era-3785be8e5c38

Thursday, December 10, 2020

Customized Transaction Log Backups

Transaction Log backups are important in a Production environment. It will make sure that you manage your log file size and keeping backups in case of a need to restore.

I am pretty much sure, most of you have scheduled transaction log backups. If you have scheduled Transaction log backups every 15 minutes, then you will see four log backups every hour and will result in nearly 100 backup files a day and you are looking at around 700 log backups per day. Unlike differential backups, you need all your lob backups to recover. Sometimes, you might have less or no transactions but still, there will be a log backup. 

Now the question is, Can we create transaction log backup when there is sufficient size. Yes, you can if you are running SQL Server 2017 or later. 

In sys.dm_db_log_stats Dynamic Management Function (DMF), there is a new column called log_since_last_log_backup_mb tells you what is the log file size after the last log backup. 

Using the following script, you can perform transaction log backups when the log file size is more than a specific size. 

DECLARE @log_since_last_log_backup_mb NUMERIC(9, 2)
DECLARE @ThreasholdSize INT = 25
DECLARE @folderName VARCHAR(30) = 'D:\DBBACKUP'
DECLARE @DatabaseName VARCHAR(30) = 'LB1'

SELECT @log_since_last_log_backup_mb = log_since_last_log_backup_mb
FROM sys.dm_db_log_stats(db_id(@DatabaseName))

IF @log_since_last_log_backup_mb > @ThreasholdSize
BEGIN
   DECLARE @fileName NVARCHAR(400) = @folderName + '\' + 
   @DatabaseName + SUBSTRING(REPLACE(CONVERT(VARCHAR, GETDATE(), 111), '/', '') 
   + REPLACE(CONVERT(VARCHAR, GETDATE(), 108), ':', ''), 0, 13) + '.bak'

	BACKUP LOG [LB1] TO DISK = @fileName
	WITH NOFORMAT
		,NOINIT
		,SKIP
		,NOREWIND
		,NOUNLOAD
		,STATS = 10
END
ELSE
	PRINT 'No BACKUP'

Monday, December 7, 2020

Technology Initiatives

If someone asks what are the top three priorities what do you say? Is it Cloud, DevOps, Machine Learnings, IoT? The following is the survey done by Flexera for 303 respondents. 


Still, DevOps, Machine Learning, Big Data are not in the priorities list though many of us are taking on those topics. Digital transformation, Cybersecurity and Cloud migrations are in the top technology initiatives. 


Friday, December 4, 2020

Database Design and Modeling with PostgreSQL

This is a self-publish book on PostgreSQL. 


This discusses all the basics of database modelling and implementations in PostgreSQL with few case studies. 

Wednesday, December 2, 2020

Epidemic Mathematical Model

Source: https://www.cirad.fr/


In these times of Covid, Epidemic has become a buzz word everywhere. While saluting the health professionals and others putting their utmost effort to salvage people wherever the in the world, do you know that there is a mathematical model for Epidemics. This model is called Epidemic Protocol or more famously Gossip Protocol.

The theory based on a population where there is an infected node, uninfected will be infected as we are observing in current Covid-19 pandemic. 

Let us look at this mathematical theory.

Though this theory is mainly used to identify the propagation of Epidemic, this theory is used to communicate between Peer-to-Peer system. https://flopezluis.github.io/gossip-simulator/is providing a simulator for the Gossip / Epidemic theory.

Tuesday, December 1, 2020

Hierarchies for Data Analytics in SSAS

In most data analytics, Hierarchies play a vital role. It provides a much easier way to analyse and present data.


There are several hierarchies that you can create such as natural hierarchies, bucketing hierarchies, unbalance hierarchies etc. 
This article describes how to create hierarchies in SQL Server Analysis Services of Multi-Dimensional models.