Translate

Tuesday, March 30, 2021

Time Series Cheat Sheet - v 5.0.0.0

This is the latest update on the Time Sheet Cheatsheet. This is after analysing the Time Series Features in Orange Data Mining Tool. 


In the new release, the following are new including. 

  1. Time series Specific diagrams are included so that they can display the existing properties of the Time Series for easy understanding. Spilarogram, Periodogram and Correlogram are those diagrams. 
  2. 1st and 2nd Order differencing are included for data normalization. 
  3. Interpolation is included as missing value replacement. 
  4. Granger Causality is included as a Time Series technique.
Next, we will be evaluating Rapid Minner for the Time Series Forecasting and hopefully new version of the Time Series Cheatsheet will be released at end of the next month. 

Wednesday, March 24, 2021

How to Recognize an Actress without her Makeup

By looking at the title you would have thought that you are at the wrong place in a technical blog. Well, technology is nothing if you don't find a proper implementation of it. In this blog post, we are looking at how to utilize image processing to identify the actress when they not under makeup. 
Thanks to this link, it was possible to find 26 Bollywood actresses with and without makeup. 
Then those two images were classified into two folders with and without makeup. 
Here are those actresses with their fancy makeup. 


Then we have another set of images where these beautiful actresses without makeup as shown below.


Now our task is to see whether we can match the non-makeup actresses with images of when they are under makeup. Important to note that when they not under makeup, image resolutions are very low which is understandable. So we need to consider that as an environmental condition without complaining about it. 

We used the Orange Data Mining tool previously for different image processing applications which you can get from this link 


In Image Embedding, the openface embedded is used as it is the most common embedded that can be used to detect faces. 
After the embedding is completed, images will be vectorized into different parameters that can be viewed from a Data Table as shown below. 


Then similar embedding will be carried out to the non-makeup images and connected by Neighbours control to find out who are the closest images. In the Neighbours Eclidiean, Manhattan, Mahalanobis, Cosine, Jaccard Spearman, Absolute Spearman, Pearson, Absolute Pearson distance measures can be used to determine the better results. 

When we clicked an image from the non-makeup list, closet images will be displayed at the Image viewer at the Neighbours control. 


Since we have asked to display three closest images, for the Actress Nargiz, it has first match the Nargix with makeup and two other images. 

Similarly, the Kajal image also matched as shown below. 


Out of the distance measures, Pearson distance was able to identify 9 out of 26 actresses and nearly match another 12 actresses. On the other hand, the Spearman distance measure identified 8 actresses while it nearly matches another 14 actresses. The Pearson measure could not identify five actresses while the Spearman distance measure could not identify three actresses. 
Of course, this dataset is not a rich dataset. So there is major room for improvement with the proper dataset. 
Finally, makeup will make you beautiful but can't hide your identity!!

Sunday, March 21, 2021

Cheat Sheet - Time Series Forecasting in Orange

A cheat sheet or crib sheet is a concise set of notes used for quick reference. We are developing cheat sheets for several aspects such as Time Series Forecasting, Recommender Systems, etc during the last few months. In Time Series, we have gone into developing cheatsheets for products such as Microsoft SQL Server, Azure Machine Learning, and Weka

After discussing the Time Series features in Orange, now let us see the cheat sheet for the Orange tool. 


We found a few features that were not found in the previous tools that we discussed before. Importantly, in Orange, there are three diagrams that show the properties time series. We will discuss those diagrams in a separate post in detail.
In Orange, Interpolate technique is used to find and replace the missing data. In the Time Series Forecasting, ARMA, ARIMA, ARIMAX and VAR are possible techniques that can be used in Orange. 
We will be meeting Rapid Miner as the next tool in our journey. Stay tuned!

Time Series Forecasting in Orange

We have been discussing on Time series for while now with different perspectives. In this journey, we are in the process of building the Cheat Sheet for Time Series that covers all aspects of Time Series. Earlier this month, a new cheat sheet version 4.5.0.1 was released. 

On this journey, we were looking at the features of the time series in different tools. We looked at the features of Microsoft SQL Server, Azure Machine Learning and WEKA till now. In this post, we are looking at the Time Series forecasting features in Orange.

Let us look at how we can Time Series Forecasting in Orange as shown in the below figure. 

In this example, the plane passenger data set was used where date as the time column while the value as the numeric, forecasting column. You can Select Columns and Select Rows as data cleaning techniques. 
Then the data set can be converted to a Time Series by using the As TimeSeries control. Then the shifting of data can be done by Difference control. Seasonal Adjustment control can be utilized to include the seasonal factor in the time series as the seasonal factor plays a key role in Time Series forecasting. 
In Orange, ARIMA modelling is available where there are few configurations to be done as shown below. 

'

In ARIMA modelling, we have indicated that there are will be four predictions with 95 confidence intervals. 
Finally, model evaluation is done in order to select the better Time Series Model. In the Model Evaluation, root mean squared error (RMSE), median absolute error (MAE), mean absolute per cent error (MAPE), prediction of change in direction (POCID), coefficient of determination (R²), Akaike information criterion (AIC), and Bayesian information criterion (BIC) parameters are used. 
Following are the model evaluation parameters for the selected ARIMA model.


By changing the ARIMA models, it was found that the best model is ARIMA(1,1,0).
Apart from the above features, there are other features like windows slicing, Spiralogram, Aggregate, Interpolate features that are also available. 

Friday, March 19, 2021

Film -> Positive , Movie -> Negative, Class Association Rule for Movie Reviews

Sentiment Analysis has become an important as well as tedious Business Task in order to explain how customers think about different products and services. 

Apart from simple sentiment analysis, you would like to know what makes your product better or worst so that you improve your products and services. Classification Association Rule (CAR) is used to find what makes your product positive or negative. 

WEKA supports the CAR option in association and let's see how we can utilize this feature.  

We have used the Film review dataset which has 2000 reviews for 1000 each for positive and negative reviews. 

By using, String to Word Vector in Weka, texts were converted to Binary Vector and Loving Stemmer, Rainbow stopwords and Alphabetic Tokenizer were used. 

In order to support, Association Rule in WEKA data set was modified and can be downloaded here

The sample of data is here. 


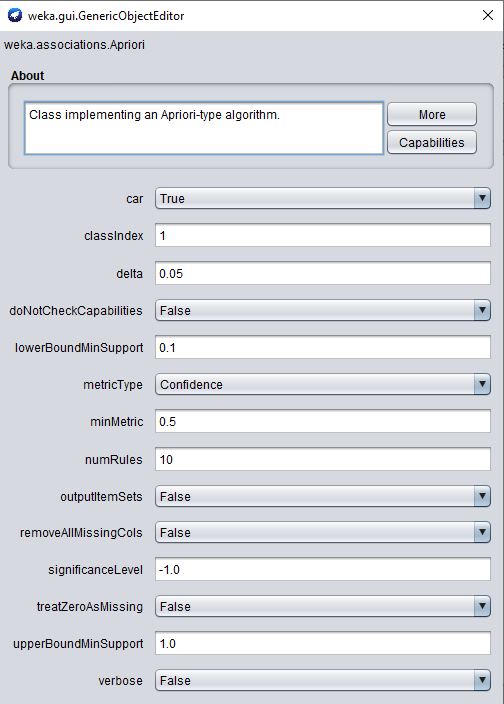
Apriori algorithm is used to find the association rules with changes as shown below. 


In the above configuration, the CAR option set to TRUE and the class index is set 1. The class index indicates, what is the index of the class parameter. Since it is the first parameter in the dataset, 1 is selected. minMetric also set 0.5 as we may not have rules for higher confidence values. 
Let us see the results. 

What do these rules say? If you look at rule 2 when the text "movie" exits review is negative. Please note that "movie" text is stammered to "movi" . The rules such as 3, 4, 5, and 8 say, text "film" tends to indicate positive review. 
This is an astonishing finding as film and movie are synonyms but they tend to have completely different sentiments. 

Wednesday, March 17, 2021

Azure Machine Learning Experiment for Named Entity Recognition


Named Entity Recognition is a key concept in Natural Language Processing. This technique used to identify Person, Places and Locations from the free text words. In Azure Machine Learning (Classical), Named Entity Recognition control can be used to detect entities. 

You can download the experiment at https://gallery.azure.ai/Experiment/Named-Entity-Recognition-News that shows how to use Named Entity Recognition in Azure Machine Learning. 

This experiment has used news content from six sources and finally, it has separated the news items that discuss Person, Organization and Location separately. This experiment has used many controls such as Join Data, Select Columns in Data Sets, Clean Missing Data, Execute Python Script, Split Data etc. 

If you wish to learn more on Azure Machine Learning, refer to the ongoing article series at SQLShack.com 

Introduction to Azure Machine Learning using Azure ML Studio

Data Cleansing in Azure Machine Learning

Prediction in Azure Machine Learning

Feature Selection in Azure Machine Learning

Data Reduction Technique: Principal Component Analysis in Azure Machine Learning

Prediction with Regression in Azure Machine Learning

Prediction with Classification in Azure Machine Learning

Comparing models in Azure Machine Learning

Cross-Validation in Azure Machine Learning

Clustering in Azure Machine Learning 

Saturday, March 13, 2021

Time Series Forecasting with Automated Machine Learning

Today I presented on Time Series Forecasting with Automated Machine Learning at Sri Lanka MCT Summit 2021 - Day 1
You can view the video from the following link. 

Time Series Forecasting with WEKA

We have been discussing on Time series for while now. In this discussion, we are in the process of building the Cheat Sheet for Time Series that covers all aspects of Time Series. Earlier this month, a new cheat sheet version 4.5.0.1 was released. 

On this journey, we were looking at the features of different tools. We looked at the features of Microsoft SQL Server and Azure Machine Learning till now. In this post, we are looking at the Time Series forecasting features of Weka. 

The following figure shows the basic components of Weka for Time Series Forecasting. 


Weka is mainly looking at the regression techniques to support Time Series forecasting. In Weka, the lag feature is used to introduce the seasonality factor to the time series. There are many evaluation techniques in Weka Time series forecasting. 
Weka has the unique feature of specifying the not existence data which is missing in many other tools. For example, for a given holiday, stock data might not be available which is not missing data. Further, you can specify what are the missing data dates. Further, it has another unique feature where you can predict stepwise.

Thursday, March 11, 2021

New AI Features Introduced for Microsoft Platform

During the virtual event of Microsoft Ignite 2021, brand new Machine Learning features were unveiled. 

Microsoft Mesh 


Microsoft Mesh enables presence and shared experiences from anywhere – on any device – through mixed reality applications.

Azure Percept


Microsoft has introduced the public preview of Azure Percept. Azure Percept is a platform of hardware and services that targets to simplify the ways in which Azure AI technologies can be used on the edge. This has the luxury of using the features of Azure cloud offerings such as device management, AI model development and analytics etc.
Azure Purview

Data Governance has become an important topic today due to the fact that data has many different sources. Microsoft introduced its unified governance service called Azure Purview.  


Azure Arc


Across industries, organizations are investing in hybrid and multi-cloud technologies to ensure they have the flexibility to innovate anywhere so that they can work on multiple platforms seamlessly. For customers, the key challenge that comes with hybrid and multi-cloud adoption is managing and securing their IT environments while building and running cloud-native applications.


Azure Synapse Pathway

Azure Synapse Pathway helps organizations to simplify the migration experience to Azure Synapse. With this tool, users can now scan their source systems and automatically translate their existing scripts into TSQL. Azure Synapse Pathway will support customers migrating from Teradata, Snowflake, Netezza, AWS Redshift, SQL Server, and Google BigQuery. 


Semantic Search
Semantic Search will use deep neural networks to rank the articles based on how “meaningful” they are relative to the query.


Form Recognizer
Form Recognizer is an Azure Cognitive Service and an AI-powered document extraction service that understands any document. The service applies advanced machine learning techniques to accurately extract the text, key or value pairs as well as tables from documents.

Wednesday, March 10, 2021

Customizing Differential and Transaction Log backups

source: NOVAbackup

In SQL Server, we used Full, Differential and Log backups to support various needs of the database administrators. However, we used to take these backups in a defined frequency without considering the data volume of each backup. 
This article discusses how to customize your backups in order to achieve better maintenance plans for database backups.

Tuesday, March 9, 2021

Time Series Cheat Sheet - v 4.5.0.1

After analysing features in the WEKA data mining tool, few features were added to the Time Series Cheat Sheet. 


Apart from the graphical cleanup, a couple of features are added to the cheat sheet. Though we have identified missing values before, there can be a situation where data is not available on some dates. For example, stock data may not be available on holidays.  
Different types of regressions are included in Statistical techniques as there are instances where regression is performing efficiently than other features. 

Sunday, March 7, 2021

Suicides Data in Sri Lanka for 2019


This is a data set for suicides data in Sri Lanka for the year 2019. No latest data is available after 2019. Some analysis was done using Power BI. 


Except for the age of less than 20 years, Males suicides dominates in all the groups. Globally Male to Female ration is 2:1 while in Sri Lanka it is 4:1 which very high.
Here are few statistics derived from the above data set. 


Thursday, March 4, 2021

Magic Quadrant for Data Science and Machine Learning Platforms -2021


Gartner has released it's magic quadrant for Data Science and Machine Learning. It is important to note that Microsoft, AWS and Google are clustered to the Visionaries quadrant, not in the Leaders quadrant. 

In the Microsoft platform, the core products considered in this Magic Quadrant is Azure Machine Learning. The supporting products for Azure Machine Learning consist of Azure Data Factory, Azure Data Catalog, Azure HDInsight, Azure Databricks, Azure DevOps, Power BI and other components.

Tuesday, March 2, 2021

Data Sets @ University of California, Irvine Machine Learning Repository


If you are working with data, no doubt that the most time-consuming part of the project is the data collection process. Before you try out any of your findings, it is essential to get a good quality dataset. 
At the University of California, Irvine (UCI) there are rich data sets in many domains.  You can get to the main page from this link. 
In this data set there multiple datasets that can be utilized for different purposes. The following is the most used data set and the famous Iris data set is the leader with a huge margin. 


You can view the properties of the data and download the data set by navigating to the link shown below. 
 

To date, they 585 datasets and you can filter them with different categories such as Type, Data Type, Area like this. 


Check and see what are the relevant datasets that you can use for your projects from the following link.