Translate

Monday, November 30, 2020

Sri Lanka Qualifications Framework (SLQF) for Higher Education

There are various types of courses available, BSc, Postgraduate Diploma, BA, MSc, MA, MBA, MDA, MPhil, PhD etc. Many of us don't know how these courses are ordered and unaware that there is a framework for these qualifications. 

In 2013, the Ministry of Higer Education with the funding from Worldbank defined the SLQF for higher education in Sri Lanka. In 2015 this was updated with the world standards, 

The following is the SLQF in summary. 


As you can see this shows the clear organization of different qualification. 
Each qualification has minimum requirements as shown in the following table. 


If you are holding any qualifications, verify whether you have achieved necessary requirements as many institutes find ways to bypass. If they have done that bypass, ultimately, you will be in trouble not them.
Importantly, you do not need to go step-by-step as there are defined pathways as shown below. 


If you want to read the details of this report you can go to the following link.

Sunday, November 29, 2020

Linguistic Analytics in Data Warehouse Using Fuzzy Techniques

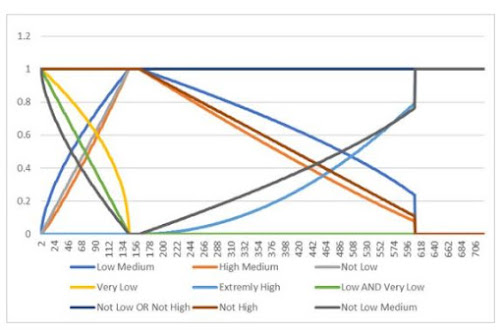
A data warehouse is no more a "nice-to-have" system in your system but it is an integral part of your data strategy to face up the fierce competition.  In most of the time, we do crisp analytics in the data warehouse such as "High", "Low" etc. What about Linguistic analytics which is shown below.

By using Fuzzy techniques this was achieved. Read the research paper at IEEE. 


By using Linguistic analytics, the following is the employee count for a different experience of employees in a factory.


This research is part of the Investigation and Development for Fuzzy Data Warehouse Project.

Thursday, November 26, 2020

Troubleshooting using Wait Stats in SQL Server

Troubleshooting is an art not a science in any domain. The same symptom may be due to different reasons. If your query is slow, it is can be due to many reasons ranging from hardware to other queries. In this latest article at Sqlshack, it is discussed how to perform troubleshooting in SQL Server using wait stats. In my personal experience, I always start my troubleshooting with Waitstats and it gives us the complete picture as well as it does not cost your system.


Wednesday, November 25, 2020

Different Types of Clustering Techniques

Clustering is an unsupervised technique that is used to perform natural grouping. Though -Means, Hierarchical and Fuzzy Clustering are the most common CLustering techniques, there are a few numbers of Clustering techniques as shown in the below figure. 


Who are the best players in Meeting Solutions?

Source: https://www.liquit.com/

During this pandemic times, meeting solutions are playing a huge role by keeping the professionals, teachers, students at home and still being able to help their work and study whether it is IT or Non-IT.

You might have your own favourite tool to communicate between your teams and groups, but who is the best among all. Let us hear from the Gartner for their opinion on these Meeting Solutions. They have come up with their traditional magic quadrants for Unified Communications as a Service and Meeting Solutions released in 2020 November. 


In both quadrants, Microsoft, Zoom and Cisco are leading and they have fallen to the visionary leader quadrant. LogMeIn and Google are challenging these leaders. 

Download a copy of the Gartner Magic Quadrant for Meeting Solutions report to get more details. 

In 2019 Cisco was leading Microsoft was lagging far behind. However, Microsoft has made significant progress over two years. 

Tuesday, November 24, 2020

Image Classification in Orange

We have discussed How Orange tool can be used for Image Clustering. Now let us look at how we can perform Classification in Orange. 

Like before, we let us select an image set which in classified folders. Those folder names will be taken as the classify names. 

Following are the set of images that were used for the Image Classification. 


These images are separated into six categories Animals, Birds, Flowers, People, Places and Trees.
The following is the Orange model. 


Let us go through the above model step by step.
In the Image Embedding, Inception V3 was used as the Image Embedder. Logistic Regression, Neural Network, SVM, Random Forest, and Naive Bayes as the classifiers. 
In the Test and Score, you can find out what are the accuracy matrices. 


According to the above figure, Logistic Regression has the highest accuracy alone with the highest F1 score and Precision. 
In classification, the Confusion matrix is an important measure to find out your prediction distributions. 
As you know, in the Confusion Matrix, diagonal is the correctly predicted results. If you want to find out what is the reason for the incorrect prediction, you can select the relevant click and view that data from the Image Viewer. 

In the confusion matrix, there are two were predicted as birds actually they were classified as birds. Look at (2, 4) cell. 
Let us look at what those two images are. 
Ok, you can't really blame the tool or the algorithm as these images have mixed of Bords and flowers. Though we have categorized them in flowers, according to the Classification algorithm, they were predicted as Birds.
We will look at a few interesting scenarios in future posts. 

Monday, November 23, 2020

Model Comparison in Azure Machine Learning

We are building models in Machine Learning. How do you know these models are correct. What are the accuracy levels of these models? As we know there are a lot of parameters to verify. In the case of Classification, we use Recall, Precision, F1 measure are the most common evaluation methods apart from accuracy. In this article, it provides how can we compare models that were built in Azure Machine Learning.

Following are the other articles in the series.

Introduction to Azure Machine Learning using Azure ML Studio
Data Cleansing in Azure Machine Learning
Prediction in Azure Machine Learning
Feature Selection in Azure Machine Learning
Data Reduction Technique: Principal Component Analysis in Azure Machine Learning
Prediction with Regression in Azure Machine Learning
Prediction with Classification in Azure Machine Learning


Saturday, November 21, 2020

IPL and Overfitting

After a long wait, Indian Premier League was started and completed for the thirteenth time with Mumbai Indian declared as the undisputed winner. 


However, this post does not do another cricket analysis which I am not an expert anyway. 

We discussed about overfitting by using USA and Sri Lankan President elections and this post is to understand overfitting from a different perspective. Overfitting is your machine learning or predicting model is too accurate. You might think that how come high accuracy is a problem as we always try to increase the accuracy of reciting models. Overfitting can occur due to two reasons. 

  1. Too little data - When you have too little data, it is very likely that the model has high accuracy but it can go wrong with the next data point. Further, with many combinations, you will be making your data less. 
  2. When unnecessary data is collected - We can predict using uncorrelated data, For example, No US president is left-handed who is divorced or No Sri Lankan President is re-elected who has moustache are classical examples for over fittings.  

Now let us look at Overfitting criterias in IPL for the champions over the last thirteen years. 

Year200820092010
ConclusionNo team has won an IPL TitleNo 4th placed team in the preliminary round has won the IPL titleNo team who is lead by an Indian player has won the Championship.
Man of the series never loos the final
EventUntil Rajasthan Royals won the ChampionshipUntil Decan Charges won the Championship who were ranked 4th in the preliminary round.Until Dhoni's Chennai Super Kings won the Championship. Previously this was won by the teams captained by Shane Warne and Adam Gilchrist.
In previous editions, Shane Watson (RR) and Adam Glischist (DC) were the Man of the series who were from the winning team. in 2010, Sachin Tendulkar was the man of series who is not part of Chennai Super Kings.
ReasonIf predicting with less data is bad, what about predicting with no data.Predicting with less data is bad.Tough the captain plays a huge role in winning, it does not make any sense to him become an Indian or Foreigner.
Year201120122013
ConclusionNo team has won the championship in continuously4th ranked team in the preliminary round was never beaten in the finalChennai Super Kings were never beaten twice in finals.
MI never beaten CSK in a final
EventChennai Super Kings won the championship in 2010 and 2011 became the first team to won the championship being the defending champion.Kolkata Knight Riders won the championship by beating the Chennai Super Kings who were 4th in the Preliminary round.in 2012 and 2013 CSK were beaten in the finals by the KKR and MI respectively.
MI and CSK has met in 2010 before in the final where CSK became the winner.
ReasonWith four data points, what you can predict is very limited. Even though historically, your accuracy is 100%.Again this prediction is correct till 2012, only one time 4th ranked made it final of the IPL championship.When you are predicting with combinations of events, it is obvious that your accuracy will be very high as there are the only handful of events.
Year201420152016
ConclusionMost runs player team has never won the IPL titleChennai Super Kings were never beaten twice in finals.
MI was never beaten CSK in a final
The third-ranked team in the preliminary stage has never beaten the second-ranked team in the final.
EventRobin Uthappa of KKR was the highest scorer in the tournament and was a member of eventual winners KKR. In three of the previous occasions, highest scorer represented runner up team but no the champions.in 2012 and 2013 CSK were beaten in the finals by the KKR and MI respectively.
MI and CSK has met in 2010 before in the final where CSK became the winner.
Sunrisers Hyderabad beat Royal challengers Banglore int he final which is the first time third-ranked team beat the second ranked team in the final. in 2010 CSK who was the third-ranked team who became the champions by beating the ranked one team.
ReasonAgain only six events before thus very fewer data do not make very good in predictions.When you are predicting with combinations of events, it is obvious that your accuracy will be very high as there are the only handful of events.Two many combinations in fewer data should not be used for predictions.
Year201720182019
ConclusionEvery MI win resulted in Highest Wicket taker is an Indian bowler. Number one ranked team has never beaten the second team in the final.CSK has never won by ChasingMI has never beaten CSK when MI was ranked 1
EventIn 2013 and 2015 MI has won the championship. in both those years, highest wickets take was Bravo from West Indies. In 2017 Bhuwaneswar Kumar was the highest wicket-taker who is an Indian.in 2010 and 2011 CSK won but by defending. This is the first time that they have won the championship by chasing.MI became champions in 2017 when they were ranked first in the preliminary stage. However, when they beat CSK in 2013 they were the second-ranked team. in 2019 they were ranked first who was able to defeat ranked two CSK.
ReasonWell, this is a combination of data and uncorrelated data.Again, by combining the team and method, you are reducing the data.Again, by combining the multiple teams and ranking, you are reducing the data.
Year20202021    2022
ConclusionMI has never won in even year.
MI hs never won chasing.
The highest number of Six hitter was never in the championship-winning team.
Fair Play team never has won the Title.
EventMI has won the championship in 2013, 2015, 2017 and 2019 and this is the first time that they have won while chasing.
Ishan Kishan (MI) who was the highest six-hitter and became the first time that six-hitter was part of the tournament champs.
Fair Play award initiated in 2012 and this is the first time that Fair Play ward winning has won the championship.
ReasonThough these are somewhat valid prediction, due to fewer data points accuracy is 100%.                                            

So, it is important to collect adequate data for the prediction but even if it is with large data when you are making predication for combinations of your attributes,  you are making your data fewer. Further, though you have data, it does not always make correlated predictions such as Fair Play Winner and Foreign Captain etc, 

Friday, November 20, 2020

MDM User Experience

MDM or Master Data Management has become a key part in the Data Strategy in enterprise organizations. Master data management (MDM) is a technology-enabled discipline in which business and IT work together to ensure the uniformity, accuracy, stewardship, semantic consistency and accountability of the enterprise’s official shared master data assets. 

How about the usage of MDM in your organization. This is survey data by Trends in Data Architecture, 2017. 

As you can see in the above figure, only 23% is fully leveraging the features of MDM. Therefore, we can easily conclude that most of the organizations still in the early stages in MDM. 

If you are looking at MDM leaders here is the  Gartner's Magic Quadrant for the MDM tools for 2020. 


Monday, November 16, 2020

Data Migration Service from Google

 According to Gartner, 75% of databases will be in the Cloud by 2023. Since we are not very far away from 2023, as organizations we need to look at the possibilities of Cloud Databases. One of the greater challenges will be data migrations. As we know, organizations have a lot of data already. To Cloud Databases to become a success story, you need mechanisms and techniques to migrate your data to cloud databases.


In that view, Google Cloud has launched new Data Migration Service (DMS). Currently DMS available in Preview in which customers can migrate MySQL, PostgreSQL, and SQL Server databases to Cloud SQL from on-premises environments or other clouds.

Customers can start migrating with DMS at no additional charge for native like-to-like migrations to Cloud SQL. Support for PostgreSQL is currently available for limited customers in Preview, with SQL Server coming soon.

You can read more details at

https://www.zdnet.com/article/google-cloud-launches-data-migration-service-to-land-database-workloads/

https://datacenternews.asia/story/google-cloud-launches-new-data-migration-service

Saturday, November 14, 2020

Cloud and Insurance

When you design your system, in most of the cases, it seems like designers taking things to be granted that Cloud will solve you most of your fault tolerance headache. Though this is true for some extend, being a system architect, you need to evaluate features of different Cloud vendors before choosing. You need to evaluate features technically without falling into the marketing traps of vendors. Mind you there is something called vendor locking. After you choose (or marry) a vendor, it is very difficult to change your vendor locking. 
I see a similarity between the cloud vendors and the insurance industry. Both are unfortunately running heavily on marketing myths. 
If you look at, Sri Lankan society before around three decades, we were a society that was not much considered about fear. Fear is something you need to introduce if you want to be  success in the insurance industry. So what did they do? They brought fear into society by means of Teledramas. What we had in teledramas? Suddenly, your spouse dies from a Moter Bike accident. Then they introduced a new scheme of insurance for Motor Bike. I can tell many stories reference to these insurance marketing.  
 In Europe, they called soap operas as the prime idea of these operas were to market soap. So we can call our teledramas, Insurance Teledramas.
After Insurance companies expand over society, now it has become something we cannot ignore. Further, you know the hassle that you need to undergo when it comes to claiming. I have a feeling that the Cloud industry will take the leaf out from the book of insurance. 
Finally, I am not saying NO for clouds, but you need to be careful with the marketing slogans of Cloud vendors before we fall into the Vendor locking trap. 

Tuesday, November 10, 2020

Is MongoDB Trending

More and more users are using MongoDB as the need for unstructured data usage is rising. As you know most of our data is unstructured and further, the growth of unstructured data is in exponential growth as shown below. 


MongoDB trends were analysed by  3T Software Labs with 18,000 professionals and it is shown that MongoDB is promising among data professional. However, you need to be little careful as 3T Software Labs is a company who is making MongoDB client tools. So this data can be little bias towards to the MongoDB anyway.

However, let us look at some of their findings. 
 
First, let us look at the MongoDB usages. 
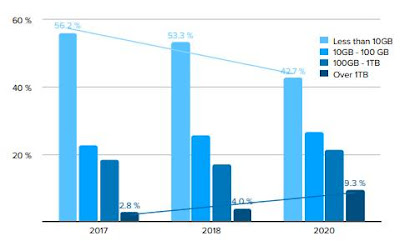
Usage of MongoDB

This figure shows that over last three years, more and more usage of MongoDB towards large volume of data in 2020 Mongdb is used in 9.3 % in over 1 TB usage of database which is a huge growth from 2017 which is 2.8%.


According to the above figure, usage of Redis has a significant growth which organisations that use only MongoDB is groped to 37% from 46%. This is due to fact that most organization now do not believe in one database god. They use different horses for different causes. 
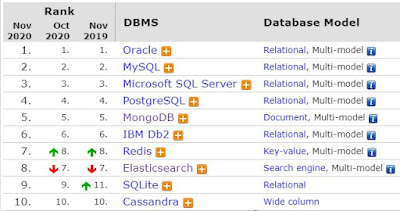
In the db-ranking MongoDB is ranked high over its counterpart as shown below. 

All of these data show that MongoDB is trending database in the industry.

Thursday, November 5, 2020

Beer & Nappy in Sri Lankan Context


If you are reading any Data Mining book or Machine Learning book, you would have come across with the classical example of beer and nappy under Association Theory or Market Basket Analysis. The story goes as men who are purchasing beer, tends to buy nappies for their kids on weekends. 

After finding this valuable information, their action was to move the nappy palate closer to the beer palate. By doing so, they were able to increase the sales volume with less time and indirectly improve customer satisfaction as well. 


I had an exicitng and different experience sometime back which is totally opposed to the above case. I was on my way for a picnic and suddenly realise that I had not brought my toothpaste and toothbrush. So I stopped at the supermarket that is not crowded. Now, you don't need machine learning to tell you that people who are buying a toothbrush will buy a toothpaste. However, in this particular supermarket, toothpaste was on the first floor and the toothbrush was on the second floor. After spending time during my rush, on my way to the cashier, I met the manager. Casually, I told him how unsatisfactory I was with the showroom arrangements.  
I received an unexpected answer. He told me that this was done purposefully. In Sri Lankan culture or maybe in other countries, when people more time in the showroom, they tend to buy more items. Therefore, by separating obvious cross-selling items, you can improve the spending time in the showroom.
When actioning an outcome, it is important to look at the cultural aspect as well rather than fully focusing on the technical aspect. 

Tuesday, November 3, 2020

Interview Question - What are the 43 Vs in Big Data

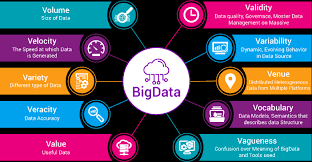
If you are asked to explain the Vs in Data in an interview, what will be your answer. Is it 3Vs, 4Vs, 5Vs, 7Vs or 10 Vs? You might be surprised that you have 43 Vs!!!

Like the evolution of data, number of Vs have evolved over time. 

Initially, it is 4Vs with Volume, Variety, Velocity and Veracity. Read detail at here

4Vs in Big Data
Source: https://www.ibmbigdatahub.com/infographic/extracting-business-value-4-vs-big-data

Then Value was added and it became 5Vs. Read details at here.
5Vs of Big Data
Source: https://www.edureka.co/blog/big-data-characteristics/

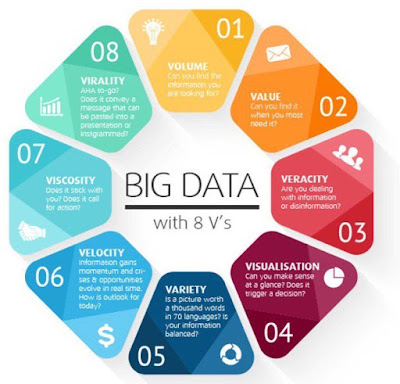
Then 5 become 8 with the additions Viscosity, Visualization, Virality, 

8Vs in Big Data
Source: https://twitter.com/vladobotsvadze/status/942197217473032192

It didn't take much longer to this to become 10 Vs. 

10Vs in Big Data
Source: http://houseofbots.com/news-detail/2819-1-the-10-v%27s-of-big-data

The latest article shows that we have 42 Vs which is not possible to draw in fancy diagrams. This article shows 42 different Vs as per in 2017. This article shows how the number of Vs have evolved over the years. 


Source: https://www.kdnuggets.com/2017/04/42-vs-big-data-data-science.html

During navigation through a Coursera course at  University of California San Diego, there is another V which is not in the 42. That is Valence. Valence in Big Data refers, to connectivity between data. When you are dealing with multiple data sets, there can be connectivity between data. When the Valence increases, you need to adapt to more complex algorithms. 

So we have 34 Vs of Properties of Big Data. Any things else you know. Surely, now this should have passed the hundred!

Sunday, November 1, 2020

Overfitting With Examples of USA and Sri Lanka Presidential Elections

Overfitting means that a model the training data too well. This occurs when you have a limited data set or too many data set.  

Let us look at the following example of US presidential elections.


With another less than a week away from the USA election, it is a good time to look at this analysis. 

1980 it is the first time that president elected after his divorce. So if we collect data with the candidates marital status, since there are no divorce presidents until 1980, our model will say that Ronald Regan will lose with 100% accuracy!
Let us look the overfitting in Sri Lankan Presidential election context. Unlike USA, Sri Lanka had only limited elections. We had eight elections in 1982, 1988, 1994, 1999, 2005, 2010, 2015 and 2019. 


Hope you understood how important it is it collect adequate data set along with important attributes rather than selecting all the attributes that you come across.