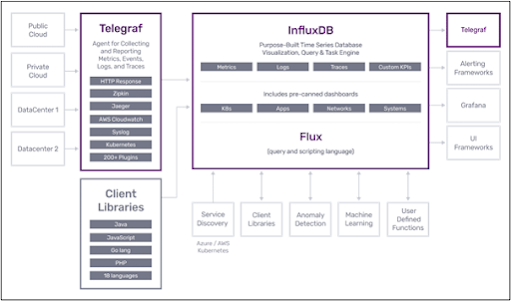
InfluxDB is a Time Series stack that will provide end-to-end features to capture, store and present time series data.
Following is the InfluxDB 2.0 stack that covers all aspects of time series data.
Let us see how we can use InfluxDB 2.0 to monitor the operating system.
First, you need to create a account to FluxDB Could.
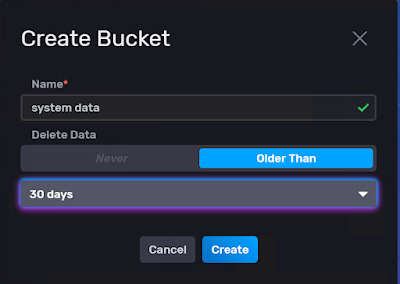
Next is to create a bucket to store the data.
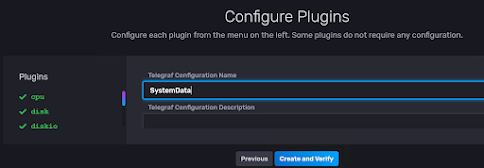
After the bucket is created, you need to configure the plugin from Telegraf.
Now you need to set the environment variable and need to execute Telegraf by using the following commands.

Then you can create a query from the following.

You can create the graph as below.

No comments:
Post a Comment